Iroquois vs Immigrants from Albania Family Poverty
COMPARE
Iroquois
Immigrants from Albania
Family Poverty
Family Poverty Comparison
Iroquois
Immigrants from Albania
10.7%
FAMILY POVERTY
0.3/ 100
METRIC RATING
251st/ 347
METRIC RANK
9.0%
FAMILY POVERTY
50.0/ 100
METRIC RATING
174th/ 347
METRIC RANK
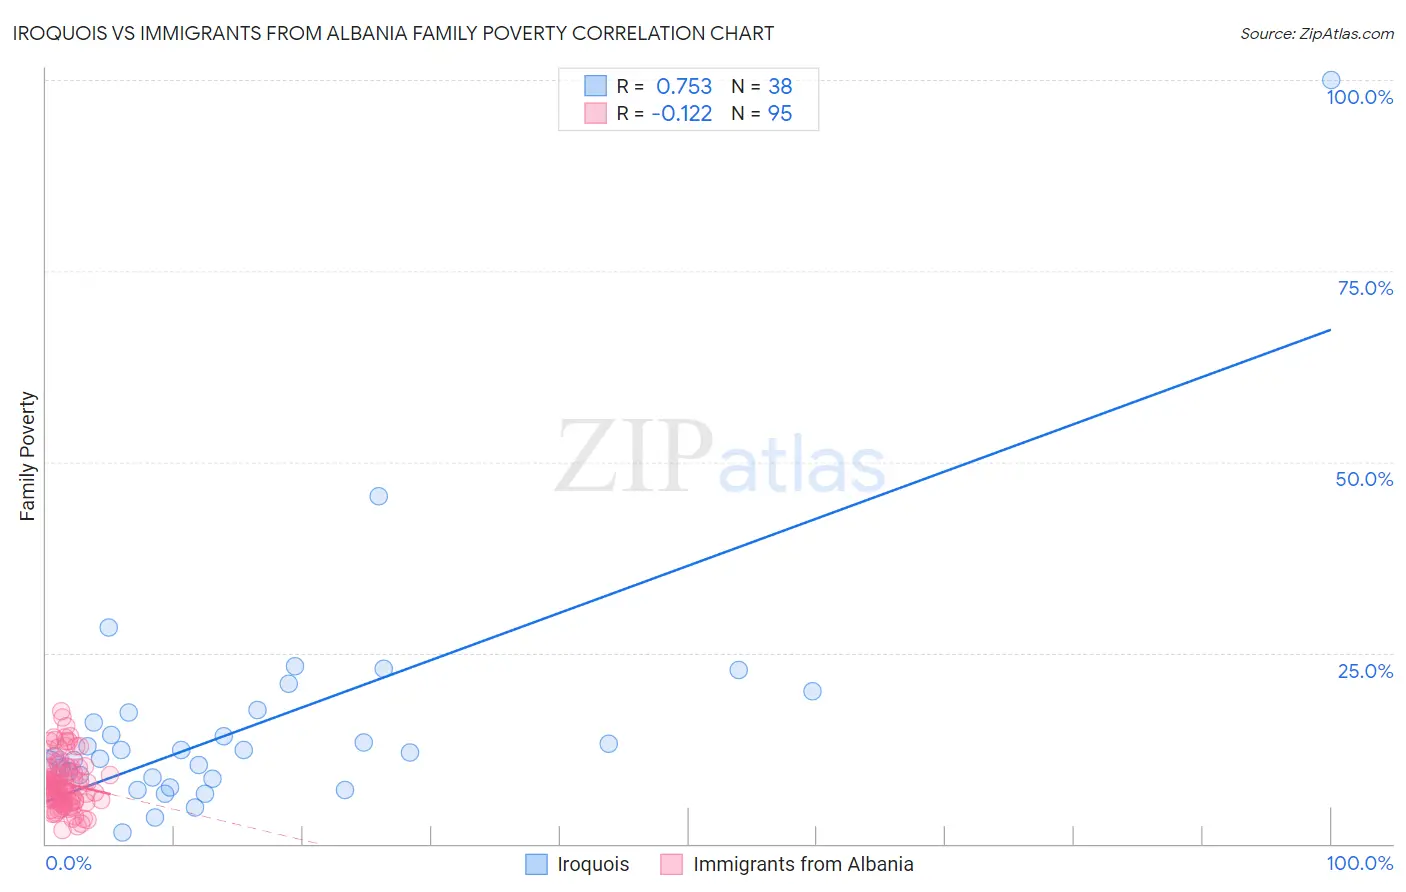
Iroquois vs Immigrants from Albania Family Poverty Correlation Chart
The statistical analysis conducted on geographies consisting of 207,014,123 people shows a strong positive correlation between the proportion of Iroquois and poverty level among families in the United States with a correlation coefficient (R) of 0.753 and weighted average of 10.7%. Similarly, the statistical analysis conducted on geographies consisting of 119,258,186 people shows a poor negative correlation between the proportion of Immigrants from Albania and poverty level among families in the United States with a correlation coefficient (R) of -0.122 and weighted average of 9.0%, a difference of 19.0%.
Family Poverty Correlation Summary
| Measurement | Iroquois | Immigrants from Albania |
| Minimum | 1.5% | 1.8% |
| Maximum | 100.0% | 17.3% |
| Range | 98.5% | 15.5% |
| Mean | 15.6% | 7.9% |
| Median | 12.1% | 7.5% |
| Interquartile 25% (IQ1) | 8.6% | 5.7% |
| Interquartile 75% (IQ3) | 17.2% | 10.0% |
| Interquartile Range (IQR) | 8.6% | 4.2% |
| Standard Deviation (Sample) | 16.1% | 3.3% |
| Standard Deviation (Population) | 15.9% | 3.3% |
Similar Demographics by Family Poverty
Demographics Similar to Iroquois by Family Poverty
In terms of family poverty, the demographic groups most similar to Iroquois are Immigrants from Zaire (10.7%, a difference of 0.12%), Immigrants from Western Africa (10.7%, a difference of 0.23%), Salvadoran (10.7%, a difference of 0.28%), Ecuadorian (10.8%, a difference of 0.53%), and Cuban (10.6%, a difference of 0.81%).
| Demographics | Rating | Rank | Family Poverty |
| Cree | 0.7 /100 | #244 | Tragic 10.5% |
| Immigrants | Burma/Myanmar | 0.6 /100 | #245 | Tragic 10.5% |
| Cherokee | 0.5 /100 | #246 | Tragic 10.6% |
| Liberians | 0.4 /100 | #247 | Tragic 10.6% |
| Nicaraguans | 0.4 /100 | #248 | Tragic 10.6% |
| Cubans | 0.4 /100 | #249 | Tragic 10.6% |
| Salvadorans | 0.3 /100 | #250 | Tragic 10.7% |
| Iroquois | 0.3 /100 | #251 | Tragic 10.7% |
| Immigrants | Zaire | 0.3 /100 | #252 | Tragic 10.7% |
| Immigrants | Western Africa | 0.3 /100 | #253 | Tragic 10.7% |
| Ecuadorians | 0.2 /100 | #254 | Tragic 10.8% |
| Immigrants | Liberia | 0.2 /100 | #255 | Tragic 10.8% |
| Chickasaw | 0.2 /100 | #256 | Tragic 10.8% |
| Immigrants | Ghana | 0.2 /100 | #257 | Tragic 10.8% |
| Sub-Saharan Africans | 0.2 /100 | #258 | Tragic 10.9% |
Demographics Similar to Immigrants from Albania by Family Poverty
In terms of family poverty, the demographic groups most similar to Immigrants from Albania are Costa Rican (9.0%, a difference of 0.090%), Immigrants from Syria (9.0%, a difference of 0.33%), Hawaiian (9.0%, a difference of 0.36%), Immigrants from Cameroon (9.0%, a difference of 0.37%), and Immigrants from Iraq (9.1%, a difference of 0.74%).
| Demographics | Rating | Rank | Family Poverty |
| Immigrants | Ethiopia | 62.5 /100 | #167 | Good 8.9% |
| Israelis | 62.1 /100 | #168 | Good 8.9% |
| Immigrants | Chile | 59.6 /100 | #169 | Average 8.9% |
| Kenyans | 58.2 /100 | #170 | Average 8.9% |
| Lebanese | 57.6 /100 | #171 | Average 8.9% |
| Immigrants | Peru | 57.5 /100 | #172 | Average 8.9% |
| Immigrants | Fiji | 56.4 /100 | #173 | Average 8.9% |
| Immigrants | Albania | 50.0 /100 | #174 | Average 9.0% |
| Costa Ricans | 49.3 /100 | #175 | Average 9.0% |
| Immigrants | Syria | 47.5 /100 | #176 | Average 9.0% |
| Hawaiians | 47.2 /100 | #177 | Average 9.0% |
| Immigrants | Cameroon | 47.1 /100 | #178 | Average 9.0% |
| Immigrants | Iraq | 44.4 /100 | #179 | Average 9.1% |
| Immigrants | Uganda | 43.4 /100 | #180 | Average 9.1% |
| Hmong | 40.2 /100 | #181 | Average 9.1% |