Iroquois vs Immigrants from Bahamas Family Poverty
COMPARE
Iroquois
Immigrants from Bahamas
Family Poverty
Family Poverty Comparison
Iroquois
Immigrants from Bahamas
10.7%
FAMILY POVERTY
0.3/ 100
METRIC RATING
251st/ 347
METRIC RANK
11.1%
FAMILY POVERTY
0.1/ 100
METRIC RATING
271st/ 347
METRIC RANK
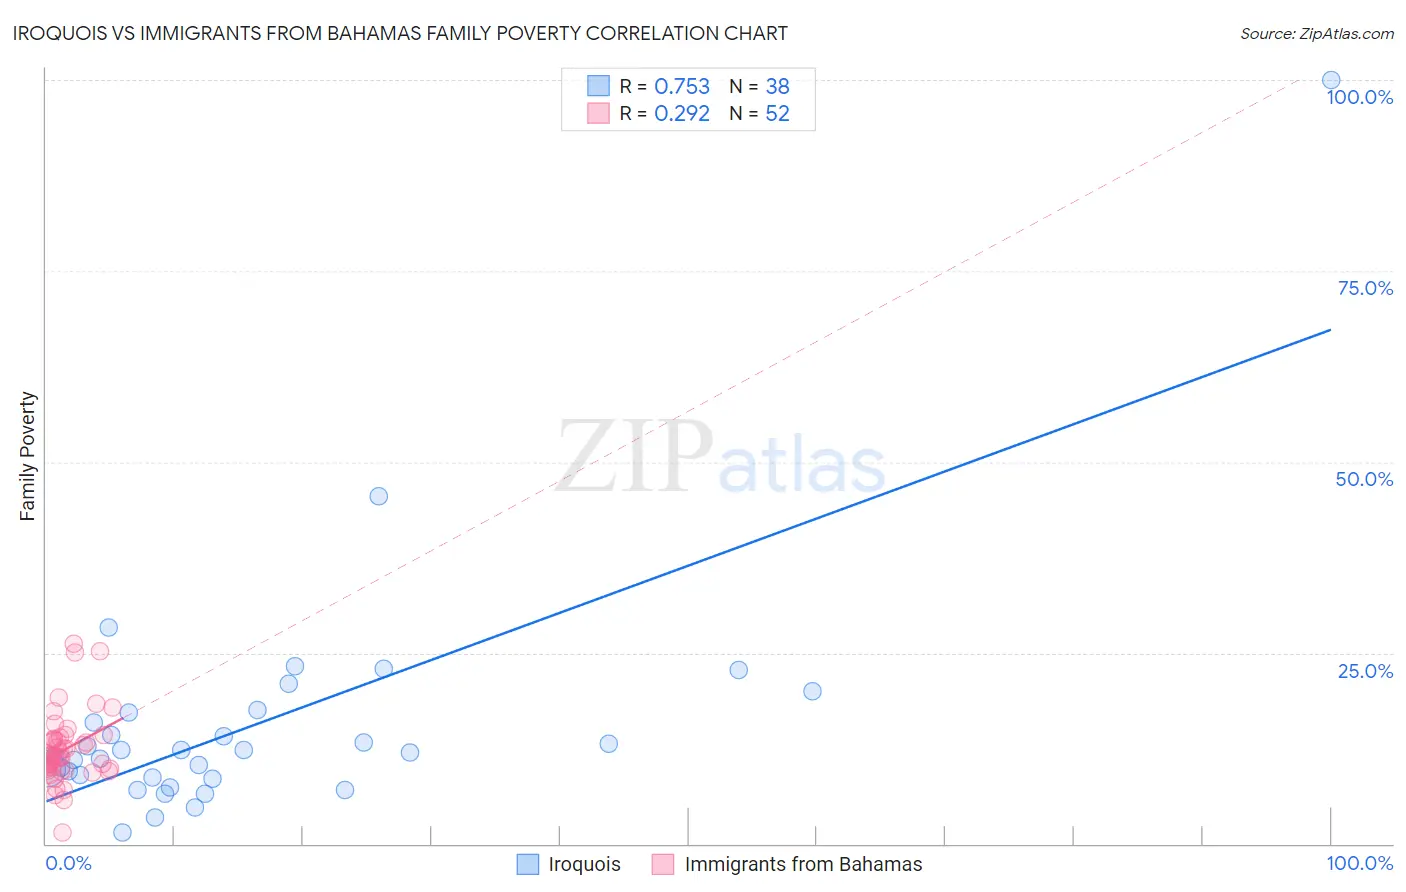
Iroquois vs Immigrants from Bahamas Family Poverty Correlation Chart
The statistical analysis conducted on geographies consisting of 207,014,123 people shows a strong positive correlation between the proportion of Iroquois and poverty level among families in the United States with a correlation coefficient (R) of 0.753 and weighted average of 10.7%. Similarly, the statistical analysis conducted on geographies consisting of 104,583,559 people shows a weak positive correlation between the proportion of Immigrants from Bahamas and poverty level among families in the United States with a correlation coefficient (R) of 0.292 and weighted average of 11.1%, a difference of 3.9%.
Family Poverty Correlation Summary
| Measurement | Iroquois | Immigrants from Bahamas |
| Minimum | 1.5% | 1.5% |
| Maximum | 100.0% | 26.2% |
| Range | 98.5% | 24.7% |
| Mean | 15.6% | 12.3% |
| Median | 12.1% | 11.4% |
| Interquartile 25% (IQ1) | 8.6% | 9.8% |
| Interquartile 75% (IQ3) | 17.2% | 13.7% |
| Interquartile Range (IQR) | 8.6% | 3.9% |
| Standard Deviation (Sample) | 16.1% | 4.6% |
| Standard Deviation (Population) | 15.9% | 4.5% |
Demographics Similar to Iroquois and Immigrants from Bahamas by Family Poverty
In terms of family poverty, the demographic groups most similar to Iroquois are Immigrants from Zaire (10.7%, a difference of 0.12%), Immigrants from Western Africa (10.7%, a difference of 0.23%), Ecuadorian (10.8%, a difference of 0.53%), Immigrants from Liberia (10.8%, a difference of 0.91%), and Chickasaw (10.8%, a difference of 1.2%). Similarly, the demographic groups most similar to Immigrants from Bahamas are Immigrants from Ecuador (11.1%, a difference of 0.25%), Immigrants from Nicaragua (11.1%, a difference of 0.25%), Jamaican (11.1%, a difference of 0.73%), Comanche (11.0%, a difference of 0.84%), and Immigrants from El Salvador (11.0%, a difference of 0.85%).
| Demographics | Rating | Rank | Family Poverty |
| Iroquois | 0.3 /100 | #251 | Tragic 10.7% |
| Immigrants | Zaire | 0.3 /100 | #252 | Tragic 10.7% |
| Immigrants | Western Africa | 0.3 /100 | #253 | Tragic 10.7% |
| Ecuadorians | 0.2 /100 | #254 | Tragic 10.8% |
| Immigrants | Liberia | 0.2 /100 | #255 | Tragic 10.8% |
| Chickasaw | 0.2 /100 | #256 | Tragic 10.8% |
| Immigrants | Ghana | 0.2 /100 | #257 | Tragic 10.8% |
| Sub-Saharan Africans | 0.2 /100 | #258 | Tragic 10.9% |
| Mexican American Indians | 0.2 /100 | #259 | Tragic 10.9% |
| Bangladeshis | 0.2 /100 | #260 | Tragic 10.9% |
| Shoshone | 0.2 /100 | #261 | Tragic 10.9% |
| Spanish American Indians | 0.2 /100 | #262 | Tragic 10.9% |
| Cape Verdeans | 0.1 /100 | #263 | Tragic 10.9% |
| Trinidadians and Tobagonians | 0.1 /100 | #264 | Tragic 10.9% |
| Immigrants | Trinidad and Tobago | 0.1 /100 | #265 | Tragic 10.9% |
| Immigrants | El Salvador | 0.1 /100 | #266 | Tragic 11.0% |
| Comanche | 0.1 /100 | #267 | Tragic 11.0% |
| Jamaicans | 0.1 /100 | #268 | Tragic 11.1% |
| Immigrants | Ecuador | 0.1 /100 | #269 | Tragic 11.1% |
| Immigrants | Nicaragua | 0.1 /100 | #270 | Tragic 11.1% |
| Immigrants | Bahamas | 0.1 /100 | #271 | Tragic 11.1% |