Iroquois vs Finnish Family Poverty
COMPARE
Iroquois
Finnish
Family Poverty
Family Poverty Comparison
Iroquois
Finns
10.7%
FAMILY POVERTY
0.3/ 100
METRIC RATING
251st/ 347
METRIC RANK
7.7%
FAMILY POVERTY
98.7/ 100
METRIC RATING
58th/ 347
METRIC RANK
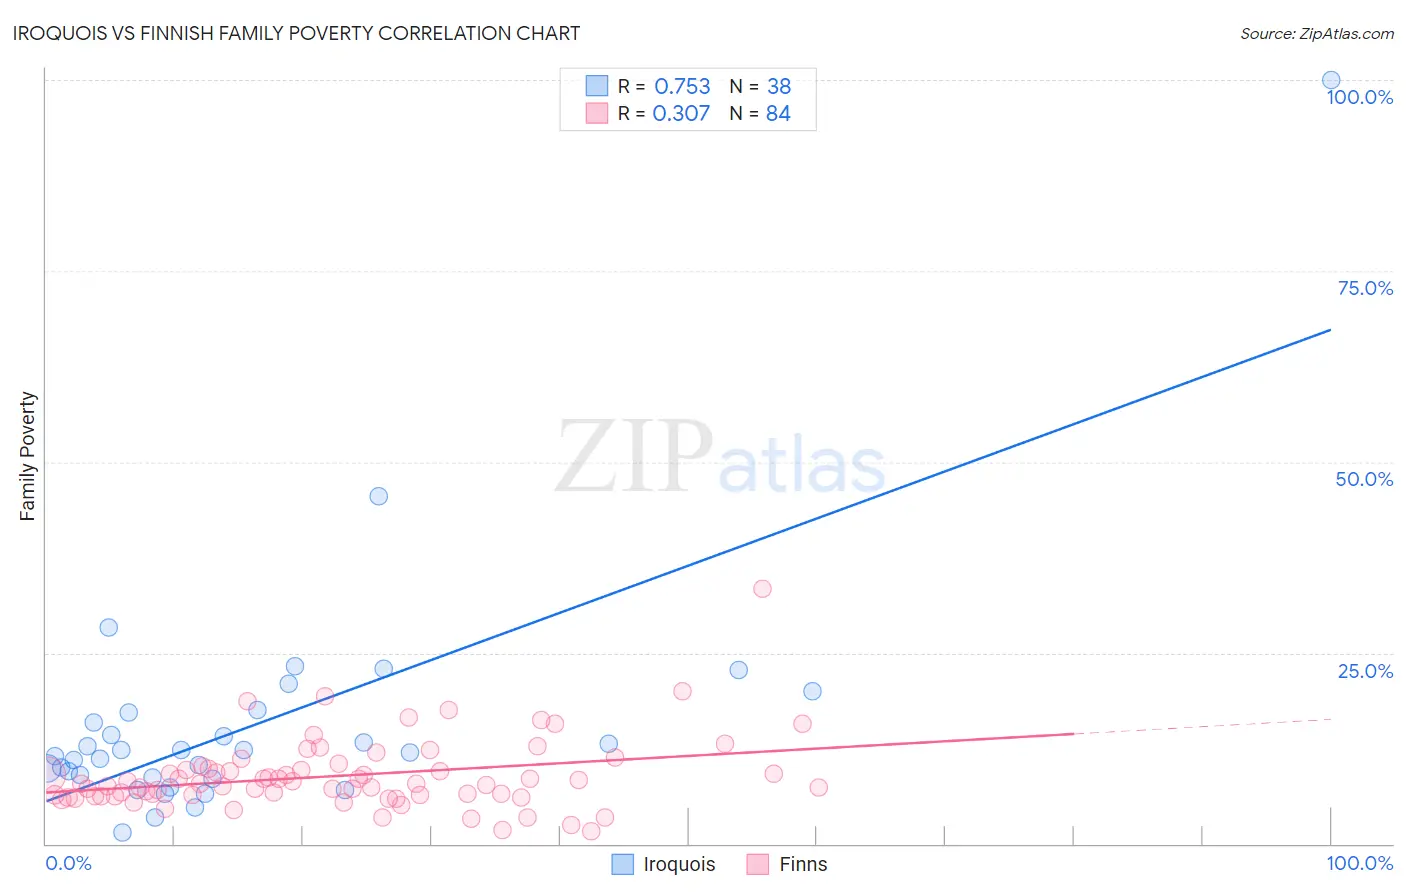
Iroquois vs Finnish Family Poverty Correlation Chart
The statistical analysis conducted on geographies consisting of 207,014,123 people shows a strong positive correlation between the proportion of Iroquois and poverty level among families in the United States with a correlation coefficient (R) of 0.753 and weighted average of 10.7%. Similarly, the statistical analysis conducted on geographies consisting of 403,232,435 people shows a mild positive correlation between the proportion of Finns and poverty level among families in the United States with a correlation coefficient (R) of 0.307 and weighted average of 7.7%, a difference of 38.7%.
Family Poverty Correlation Summary
| Measurement | Iroquois | Finnish |
| Minimum | 1.5% | 1.7% |
| Maximum | 100.0% | 33.3% |
| Range | 98.5% | 31.6% |
| Mean | 15.6% | 8.9% |
| Median | 12.1% | 7.8% |
| Interquartile 25% (IQ1) | 8.6% | 6.3% |
| Interquartile 75% (IQ3) | 17.2% | 9.8% |
| Interquartile Range (IQR) | 8.6% | 3.5% |
| Standard Deviation (Sample) | 16.1% | 4.7% |
| Standard Deviation (Population) | 15.9% | 4.7% |
Similar Demographics by Family Poverty
Demographics Similar to Iroquois by Family Poverty
In terms of family poverty, the demographic groups most similar to Iroquois are Immigrants from Zaire (10.7%, a difference of 0.12%), Immigrants from Western Africa (10.7%, a difference of 0.23%), Salvadoran (10.7%, a difference of 0.28%), Ecuadorian (10.8%, a difference of 0.53%), and Cuban (10.6%, a difference of 0.81%).
| Demographics | Rating | Rank | Family Poverty |
| Cree | 0.7 /100 | #244 | Tragic 10.5% |
| Immigrants | Burma/Myanmar | 0.6 /100 | #245 | Tragic 10.5% |
| Cherokee | 0.5 /100 | #246 | Tragic 10.6% |
| Liberians | 0.4 /100 | #247 | Tragic 10.6% |
| Nicaraguans | 0.4 /100 | #248 | Tragic 10.6% |
| Cubans | 0.4 /100 | #249 | Tragic 10.6% |
| Salvadorans | 0.3 /100 | #250 | Tragic 10.7% |
| Iroquois | 0.3 /100 | #251 | Tragic 10.7% |
| Immigrants | Zaire | 0.3 /100 | #252 | Tragic 10.7% |
| Immigrants | Western Africa | 0.3 /100 | #253 | Tragic 10.7% |
| Ecuadorians | 0.2 /100 | #254 | Tragic 10.8% |
| Immigrants | Liberia | 0.2 /100 | #255 | Tragic 10.8% |
| Chickasaw | 0.2 /100 | #256 | Tragic 10.8% |
| Immigrants | Ghana | 0.2 /100 | #257 | Tragic 10.8% |
| Sub-Saharan Africans | 0.2 /100 | #258 | Tragic 10.9% |
Demographics Similar to Finns by Family Poverty
In terms of family poverty, the demographic groups most similar to Finns are European (7.7%, a difference of 0.010%), Immigrants from Greece (7.7%, a difference of 0.020%), Asian (7.7%, a difference of 0.030%), Immigrants from Serbia (7.7%, a difference of 0.12%), and Immigrants from Eastern Asia (7.7%, a difference of 0.16%).
| Demographics | Rating | Rank | Family Poverty |
| Immigrants | Moldova | 98.8 /100 | #51 | Exceptional 7.7% |
| Indians (Asian) | 98.8 /100 | #52 | Exceptional 7.7% |
| Swiss | 98.8 /100 | #53 | Exceptional 7.7% |
| Immigrants | Sweden | 98.8 /100 | #54 | Exceptional 7.7% |
| Immigrants | Eastern Asia | 98.7 /100 | #55 | Exceptional 7.7% |
| Immigrants | Serbia | 98.7 /100 | #56 | Exceptional 7.7% |
| Asians | 98.7 /100 | #57 | Exceptional 7.7% |
| Finns | 98.7 /100 | #58 | Exceptional 7.7% |
| Europeans | 98.7 /100 | #59 | Exceptional 7.7% |
| Immigrants | Greece | 98.7 /100 | #60 | Exceptional 7.7% |
| Immigrants | Netherlands | 98.6 /100 | #61 | Exceptional 7.7% |
| Macedonians | 98.6 /100 | #62 | Exceptional 7.8% |
| Zimbabweans | 98.4 /100 | #63 | Exceptional 7.8% |
| Koreans | 98.3 /100 | #64 | Exceptional 7.8% |
| Immigrants | Bulgaria | 98.3 /100 | #65 | Exceptional 7.8% |