Chilean vs Immigrants from Eritrea Family Poverty
COMPARE
Chilean
Immigrants from Eritrea
Family Poverty
Family Poverty Comparison
Chileans
Immigrants from Eritrea
8.5%
FAMILY POVERTY
86.6/ 100
METRIC RATING
134th/ 347
METRIC RANK
9.9%
FAMILY POVERTY
5.4/ 100
METRIC RATING
219th/ 347
METRIC RANK
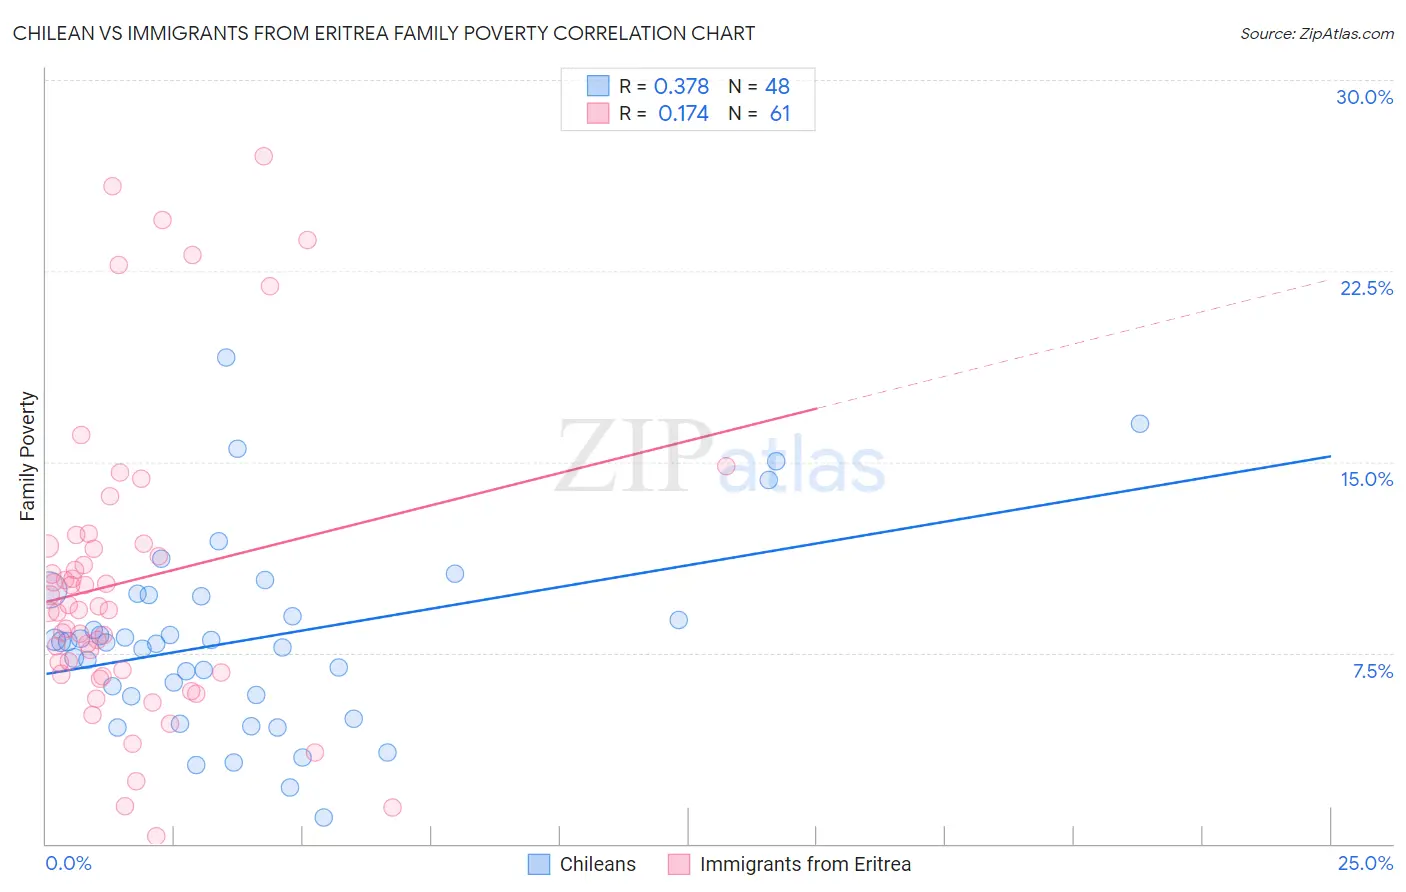
Chilean vs Immigrants from Eritrea Family Poverty Correlation Chart
The statistical analysis conducted on geographies consisting of 256,264,406 people shows a mild positive correlation between the proportion of Chileans and poverty level among families in the United States with a correlation coefficient (R) of 0.378 and weighted average of 8.5%. Similarly, the statistical analysis conducted on geographies consisting of 104,784,674 people shows a poor positive correlation between the proportion of Immigrants from Eritrea and poverty level among families in the United States with a correlation coefficient (R) of 0.174 and weighted average of 9.9%, a difference of 16.5%.
Family Poverty Correlation Summary
| Measurement | Chilean | Immigrants from Eritrea |
| Minimum | 1.0% | 0.28% |
| Maximum | 19.1% | 27.0% |
| Range | 18.1% | 26.7% |
| Mean | 8.0% | 10.3% |
| Median | 7.9% | 9.2% |
| Interquartile 25% (IQ1) | 5.8% | 6.7% |
| Interquartile 75% (IQ3) | 9.7% | 11.7% |
| Interquartile Range (IQR) | 3.9% | 5.0% |
| Standard Deviation (Sample) | 3.7% | 6.0% |
| Standard Deviation (Population) | 3.6% | 5.9% |
Similar Demographics by Family Poverty
Demographics Similar to Chileans by Family Poverty
In terms of family poverty, the demographic groups most similar to Chileans are Sri Lankan (8.5%, a difference of 0.010%), Immigrants from Malaysia (8.5%, a difference of 0.040%), Immigrants from Brazil (8.5%, a difference of 0.080%), Immigrants from Southern Europe (8.5%, a difference of 0.16%), and Immigrants from Argentina (8.4%, a difference of 0.51%).
| Demographics | Rating | Rank | Family Poverty |
| Immigrants | Hungary | 89.9 /100 | #127 | Excellent 8.4% |
| Argentineans | 89.6 /100 | #128 | Excellent 8.4% |
| Portuguese | 89.2 /100 | #129 | Excellent 8.4% |
| Immigrants | Bosnia and Herzegovina | 88.6 /100 | #130 | Excellent 8.4% |
| Puget Sound Salish | 88.6 /100 | #131 | Excellent 8.4% |
| Immigrants | Argentina | 88.2 /100 | #132 | Excellent 8.4% |
| Sri Lankans | 86.6 /100 | #133 | Excellent 8.5% |
| Chileans | 86.6 /100 | #134 | Excellent 8.5% |
| Immigrants | Malaysia | 86.5 /100 | #135 | Excellent 8.5% |
| Immigrants | Brazil | 86.3 /100 | #136 | Excellent 8.5% |
| Immigrants | Southern Europe | 86.0 /100 | #137 | Excellent 8.5% |
| Armenians | 84.6 /100 | #138 | Excellent 8.5% |
| Immigrants | Nepal | 84.2 /100 | #139 | Excellent 8.5% |
| Immigrants | Kazakhstan | 84.1 /100 | #140 | Excellent 8.5% |
| Immigrants | Ukraine | 83.9 /100 | #141 | Excellent 8.5% |
Demographics Similar to Immigrants from Eritrea by Family Poverty
In terms of family poverty, the demographic groups most similar to Immigrants from Eritrea are Bermudan (9.9%, a difference of 0.060%), Panamanian (9.8%, a difference of 0.13%), Immigrants from Cambodia (9.9%, a difference of 0.33%), Japanese (9.9%, a difference of 0.36%), and American (9.8%, a difference of 0.44%).
| Demographics | Rating | Rank | Family Poverty |
| Immigrants | Thailand | 9.7 /100 | #212 | Tragic 9.7% |
| Osage | 8.0 /100 | #213 | Tragic 9.7% |
| Immigrants | Micronesia | 6.7 /100 | #214 | Tragic 9.8% |
| Immigrants | Nonimmigrants | 6.7 /100 | #215 | Tragic 9.8% |
| Moroccans | 6.5 /100 | #216 | Tragic 9.8% |
| Americans | 6.2 /100 | #217 | Tragic 9.8% |
| Panamanians | 5.6 /100 | #218 | Tragic 9.8% |
| Immigrants | Eritrea | 5.4 /100 | #219 | Tragic 9.9% |
| Bermudans | 5.3 /100 | #220 | Tragic 9.9% |
| Immigrants | Cambodia | 4.8 /100 | #221 | Tragic 9.9% |
| Japanese | 4.8 /100 | #222 | Tragic 9.9% |
| Immigrants | Africa | 4.3 /100 | #223 | Tragic 9.9% |
| Marshallese | 3.9 /100 | #224 | Tragic 9.9% |
| Immigrants | Immigrants | 3.6 /100 | #225 | Tragic 10.0% |
| Ottawa | 3.3 /100 | #226 | Tragic 10.0% |