Iroquois vs Immigrants from Eastern Europe Family Poverty
COMPARE
Iroquois
Immigrants from Eastern Europe
Family Poverty
Family Poverty Comparison
Iroquois
Immigrants from Eastern Europe
10.7%
FAMILY POVERTY
0.3/ 100
METRIC RATING
251st/ 347
METRIC RANK
8.1%
FAMILY POVERTY
95.6/ 100
METRIC RATING
103rd/ 347
METRIC RANK
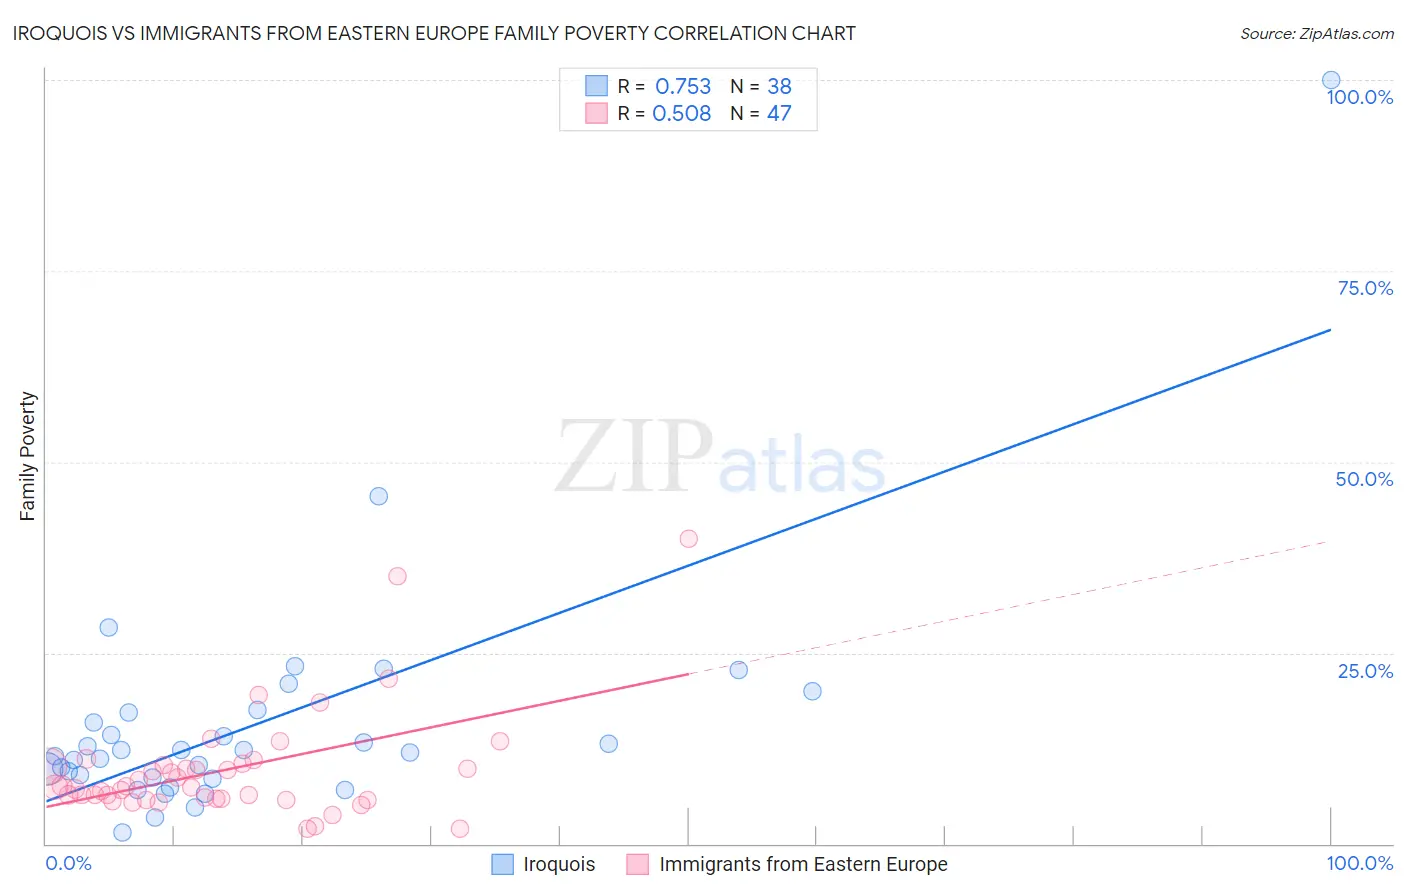
Iroquois vs Immigrants from Eastern Europe Family Poverty Correlation Chart
The statistical analysis conducted on geographies consisting of 207,014,123 people shows a strong positive correlation between the proportion of Iroquois and poverty level among families in the United States with a correlation coefficient (R) of 0.753 and weighted average of 10.7%. Similarly, the statistical analysis conducted on geographies consisting of 473,559,356 people shows a substantial positive correlation between the proportion of Immigrants from Eastern Europe and poverty level among families in the United States with a correlation coefficient (R) of 0.508 and weighted average of 8.1%, a difference of 32.4%.
Family Poverty Correlation Summary
| Measurement | Iroquois | Immigrants from Eastern Europe |
| Minimum | 1.5% | 1.9% |
| Maximum | 100.0% | 40.0% |
| Range | 98.5% | 38.1% |
| Mean | 15.6% | 9.6% |
| Median | 12.1% | 7.4% |
| Interquartile 25% (IQ1) | 8.6% | 5.9% |
| Interquartile 75% (IQ3) | 17.2% | 10.4% |
| Interquartile Range (IQR) | 8.6% | 4.4% |
| Standard Deviation (Sample) | 16.1% | 7.2% |
| Standard Deviation (Population) | 15.9% | 7.1% |
Similar Demographics by Family Poverty
Demographics Similar to Iroquois by Family Poverty
In terms of family poverty, the demographic groups most similar to Iroquois are Immigrants from Zaire (10.7%, a difference of 0.12%), Immigrants from Western Africa (10.7%, a difference of 0.23%), Salvadoran (10.7%, a difference of 0.28%), Ecuadorian (10.8%, a difference of 0.53%), and Cuban (10.6%, a difference of 0.81%).
| Demographics | Rating | Rank | Family Poverty |
| Cree | 0.7 /100 | #244 | Tragic 10.5% |
| Immigrants | Burma/Myanmar | 0.6 /100 | #245 | Tragic 10.5% |
| Cherokee | 0.5 /100 | #246 | Tragic 10.6% |
| Liberians | 0.4 /100 | #247 | Tragic 10.6% |
| Nicaraguans | 0.4 /100 | #248 | Tragic 10.6% |
| Cubans | 0.4 /100 | #249 | Tragic 10.6% |
| Salvadorans | 0.3 /100 | #250 | Tragic 10.7% |
| Iroquois | 0.3 /100 | #251 | Tragic 10.7% |
| Immigrants | Zaire | 0.3 /100 | #252 | Tragic 10.7% |
| Immigrants | Western Africa | 0.3 /100 | #253 | Tragic 10.7% |
| Ecuadorians | 0.2 /100 | #254 | Tragic 10.8% |
| Immigrants | Liberia | 0.2 /100 | #255 | Tragic 10.8% |
| Chickasaw | 0.2 /100 | #256 | Tragic 10.8% |
| Immigrants | Ghana | 0.2 /100 | #257 | Tragic 10.8% |
| Sub-Saharan Africans | 0.2 /100 | #258 | Tragic 10.9% |
Demographics Similar to Immigrants from Eastern Europe by Family Poverty
In terms of family poverty, the demographic groups most similar to Immigrants from Eastern Europe are Slavic (8.1%, a difference of 0.010%), Laotian (8.1%, a difference of 0.040%), Immigrants from Indonesia (8.1%, a difference of 0.090%), Immigrants from Norway (8.1%, a difference of 0.10%), and New Zealander (8.1%, a difference of 0.13%).
| Demographics | Rating | Rank | Family Poverty |
| Immigrants | Turkey | 96.5 /100 | #96 | Exceptional 8.0% |
| Immigrants | Switzerland | 96.1 /100 | #97 | Exceptional 8.1% |
| Immigrants | South Africa | 95.9 /100 | #98 | Exceptional 8.1% |
| Welsh | 95.8 /100 | #99 | Exceptional 8.1% |
| New Zealanders | 95.8 /100 | #100 | Exceptional 8.1% |
| Immigrants | Norway | 95.7 /100 | #101 | Exceptional 8.1% |
| Immigrants | Indonesia | 95.7 /100 | #102 | Exceptional 8.1% |
| Immigrants | Eastern Europe | 95.6 /100 | #103 | Exceptional 8.1% |
| Slavs | 95.6 /100 | #104 | Exceptional 8.1% |
| Laotians | 95.6 /100 | #105 | Exceptional 8.1% |
| Egyptians | 95.1 /100 | #106 | Exceptional 8.1% |
| French Canadians | 95.0 /100 | #107 | Exceptional 8.1% |
| Basques | 94.9 /100 | #108 | Exceptional 8.1% |
| Jordanians | 94.8 /100 | #109 | Exceptional 8.2% |
| Romanians | 94.7 /100 | #110 | Exceptional 8.2% |