Thai vs Immigrants from Eritrea Family Poverty
COMPARE
Thai
Immigrants from Eritrea
Family Poverty
Family Poverty Comparison
Thais
Immigrants from Eritrea
6.7%
FAMILY POVERTY
100.0/ 100
METRIC RATING
5th/ 347
METRIC RANK
9.9%
FAMILY POVERTY
5.4/ 100
METRIC RATING
219th/ 347
METRIC RANK
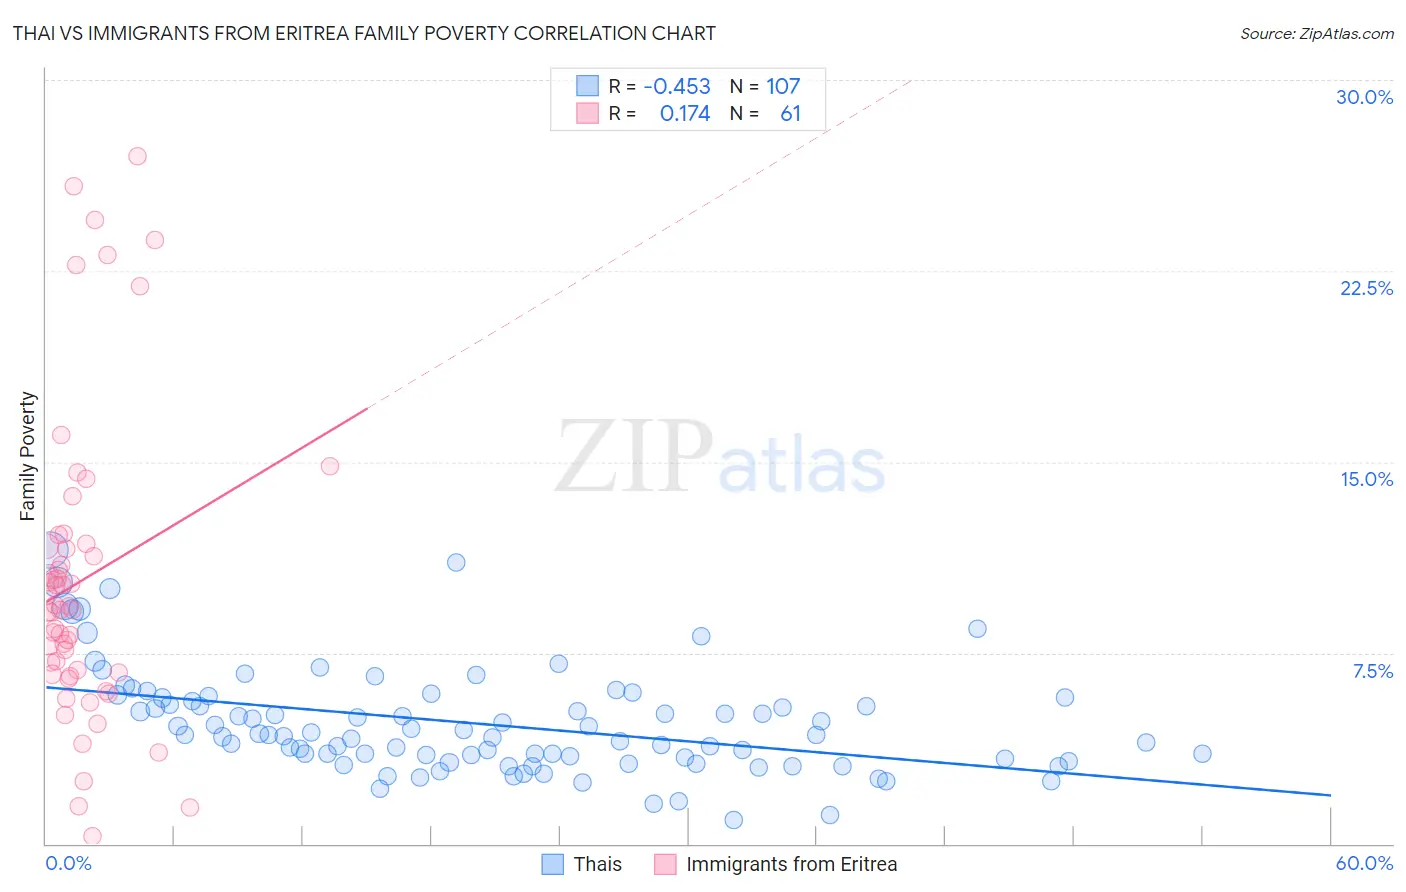
Thai vs Immigrants from Eritrea Family Poverty Correlation Chart
The statistical analysis conducted on geographies consisting of 473,767,426 people shows a moderate negative correlation between the proportion of Thais and poverty level among families in the United States with a correlation coefficient (R) of -0.453 and weighted average of 6.7%. Similarly, the statistical analysis conducted on geographies consisting of 104,784,674 people shows a poor positive correlation between the proportion of Immigrants from Eritrea and poverty level among families in the United States with a correlation coefficient (R) of 0.174 and weighted average of 9.9%, a difference of 47.3%.
Family Poverty Correlation Summary
| Measurement | Thai | Immigrants from Eritrea |
| Minimum | 0.91% | 0.28% |
| Maximum | 11.5% | 27.0% |
| Range | 10.6% | 26.7% |
| Mean | 4.7% | 10.3% |
| Median | 4.3% | 9.2% |
| Interquartile 25% (IQ1) | 3.3% | 6.7% |
| Interquartile 75% (IQ3) | 5.7% | 11.7% |
| Interquartile Range (IQR) | 2.4% | 5.0% |
| Standard Deviation (Sample) | 2.1% | 6.0% |
| Standard Deviation (Population) | 2.1% | 5.9% |
Similar Demographics by Family Poverty
Demographics Similar to Thais by Family Poverty
In terms of family poverty, the demographic groups most similar to Thais are Filipino (6.6%, a difference of 0.57%), Immigrants from Taiwan (6.6%, a difference of 1.2%), Chinese (6.5%, a difference of 2.8%), Norwegian (6.9%, a difference of 3.0%), and Immigrants from Ireland (7.0%, a difference of 4.4%).
| Demographics | Rating | Rank | Family Poverty |
| Immigrants | India | 100.0 /100 | #1 | Exceptional 6.2% |
| Chinese | 100.0 /100 | #2 | Exceptional 6.5% |
| Immigrants | Taiwan | 100.0 /100 | #3 | Exceptional 6.6% |
| Filipinos | 100.0 /100 | #4 | Exceptional 6.6% |
| Thais | 100.0 /100 | #5 | Exceptional 6.7% |
| Norwegians | 99.9 /100 | #6 | Exceptional 6.9% |
| Immigrants | Ireland | 99.9 /100 | #7 | Exceptional 7.0% |
| Bhutanese | 99.9 /100 | #8 | Exceptional 7.0% |
| Latvians | 99.9 /100 | #9 | Exceptional 7.1% |
| Bulgarians | 99.8 /100 | #10 | Exceptional 7.1% |
| Immigrants | Singapore | 99.8 /100 | #11 | Exceptional 7.1% |
| Maltese | 99.8 /100 | #12 | Exceptional 7.1% |
| Swedes | 99.8 /100 | #13 | Exceptional 7.1% |
| Iranians | 99.8 /100 | #14 | Exceptional 7.1% |
| Lithuanians | 99.8 /100 | #15 | Exceptional 7.2% |
Demographics Similar to Immigrants from Eritrea by Family Poverty
In terms of family poverty, the demographic groups most similar to Immigrants from Eritrea are Bermudan (9.9%, a difference of 0.060%), Panamanian (9.8%, a difference of 0.13%), Immigrants from Cambodia (9.9%, a difference of 0.33%), Japanese (9.9%, a difference of 0.36%), and American (9.8%, a difference of 0.44%).
| Demographics | Rating | Rank | Family Poverty |
| Immigrants | Thailand | 9.7 /100 | #212 | Tragic 9.7% |
| Osage | 8.0 /100 | #213 | Tragic 9.7% |
| Immigrants | Micronesia | 6.7 /100 | #214 | Tragic 9.8% |
| Immigrants | Nonimmigrants | 6.7 /100 | #215 | Tragic 9.8% |
| Moroccans | 6.5 /100 | #216 | Tragic 9.8% |
| Americans | 6.2 /100 | #217 | Tragic 9.8% |
| Panamanians | 5.6 /100 | #218 | Tragic 9.8% |
| Immigrants | Eritrea | 5.4 /100 | #219 | Tragic 9.9% |
| Bermudans | 5.3 /100 | #220 | Tragic 9.9% |
| Immigrants | Cambodia | 4.8 /100 | #221 | Tragic 9.9% |
| Japanese | 4.8 /100 | #222 | Tragic 9.9% |
| Immigrants | Africa | 4.3 /100 | #223 | Tragic 9.9% |
| Marshallese | 3.9 /100 | #224 | Tragic 9.9% |
| Immigrants | Immigrants | 3.6 /100 | #225 | Tragic 10.0% |
| Ottawa | 3.3 /100 | #226 | Tragic 10.0% |