Venezuelan vs Immigrants from Eritrea Family Poverty
COMPARE
Venezuelan
Immigrants from Eritrea
Family Poverty
Family Poverty Comparison
Venezuelans
Immigrants from Eritrea
9.3%
FAMILY POVERTY
27.4/ 100
METRIC RATING
195th/ 347
METRIC RANK
9.9%
FAMILY POVERTY
5.4/ 100
METRIC RATING
219th/ 347
METRIC RANK
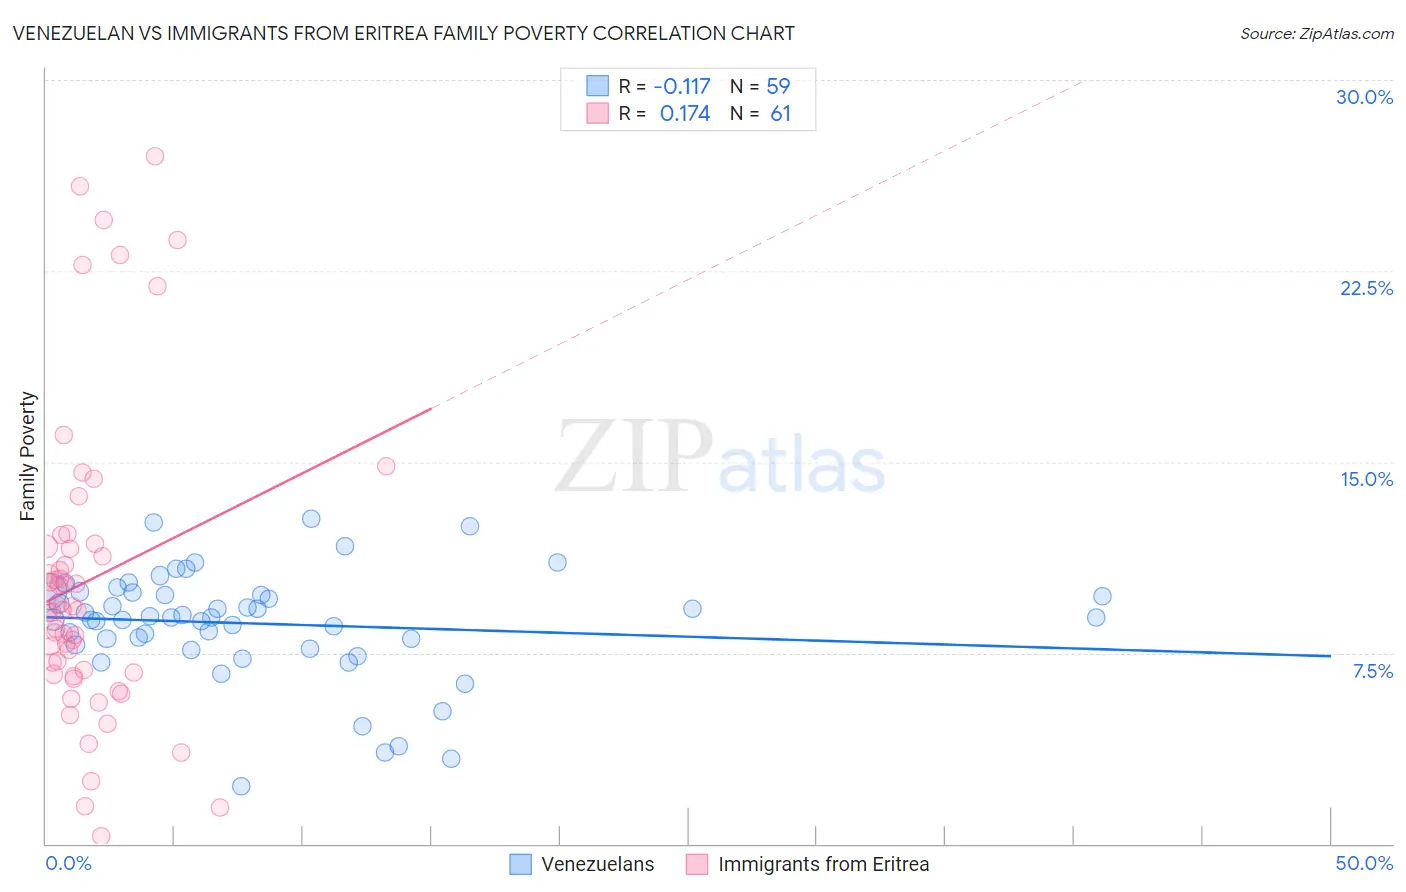
Venezuelan vs Immigrants from Eritrea Family Poverty Correlation Chart
The statistical analysis conducted on geographies consisting of 305,744,356 people shows a poor negative correlation between the proportion of Venezuelans and poverty level among families in the United States with a correlation coefficient (R) of -0.117 and weighted average of 9.3%. Similarly, the statistical analysis conducted on geographies consisting of 104,784,674 people shows a poor positive correlation between the proportion of Immigrants from Eritrea and poverty level among families in the United States with a correlation coefficient (R) of 0.174 and weighted average of 9.9%, a difference of 6.0%.
Family Poverty Correlation Summary
| Measurement | Venezuelan | Immigrants from Eritrea |
| Minimum | 2.3% | 0.28% |
| Maximum | 12.8% | 27.0% |
| Range | 10.5% | 26.7% |
| Mean | 8.6% | 10.3% |
| Median | 8.9% | 9.2% |
| Interquartile 25% (IQ1) | 7.8% | 6.7% |
| Interquartile 75% (IQ3) | 9.9% | 11.7% |
| Interquartile Range (IQR) | 2.0% | 5.0% |
| Standard Deviation (Sample) | 2.2% | 6.0% |
| Standard Deviation (Population) | 2.1% | 5.9% |
Similar Demographics by Family Poverty
Demographics Similar to Venezuelans by Family Poverty
In terms of family poverty, the demographic groups most similar to Venezuelans are South American (9.3%, a difference of 0.12%), Immigrants from Western Asia (9.3%, a difference of 0.13%), Spanish (9.3%, a difference of 0.21%), Immigrants from Venezuela (9.3%, a difference of 0.21%), and Ugandan (9.3%, a difference of 0.22%).
| Demographics | Rating | Rank | Family Poverty |
| Immigrants | Kenya | 34.0 /100 | #188 | Fair 9.2% |
| Immigrants | Afghanistan | 32.1 /100 | #189 | Fair 9.2% |
| Arabs | 31.5 /100 | #190 | Fair 9.2% |
| Ugandans | 28.7 /100 | #191 | Fair 9.3% |
| Spanish | 28.7 /100 | #192 | Fair 9.3% |
| Immigrants | Western Asia | 28.2 /100 | #193 | Fair 9.3% |
| South Americans | 28.1 /100 | #194 | Fair 9.3% |
| Venezuelans | 27.4 /100 | #195 | Fair 9.3% |
| Immigrants | Venezuela | 26.1 /100 | #196 | Fair 9.3% |
| Immigrants | Colombia | 24.4 /100 | #197 | Fair 9.3% |
| Iraqis | 24.2 /100 | #198 | Fair 9.3% |
| Spaniards | 22.8 /100 | #199 | Fair 9.4% |
| Immigrants | Costa Rica | 21.7 /100 | #200 | Fair 9.4% |
| Immigrants | Portugal | 20.5 /100 | #201 | Fair 9.4% |
| Immigrants | Sierra Leone | 19.6 /100 | #202 | Poor 9.4% |
Demographics Similar to Immigrants from Eritrea by Family Poverty
In terms of family poverty, the demographic groups most similar to Immigrants from Eritrea are Bermudan (9.9%, a difference of 0.060%), Panamanian (9.8%, a difference of 0.13%), Immigrants from Cambodia (9.9%, a difference of 0.33%), Japanese (9.9%, a difference of 0.36%), and American (9.8%, a difference of 0.44%).
| Demographics | Rating | Rank | Family Poverty |
| Immigrants | Thailand | 9.7 /100 | #212 | Tragic 9.7% |
| Osage | 8.0 /100 | #213 | Tragic 9.7% |
| Immigrants | Micronesia | 6.7 /100 | #214 | Tragic 9.8% |
| Immigrants | Nonimmigrants | 6.7 /100 | #215 | Tragic 9.8% |
| Moroccans | 6.5 /100 | #216 | Tragic 9.8% |
| Americans | 6.2 /100 | #217 | Tragic 9.8% |
| Panamanians | 5.6 /100 | #218 | Tragic 9.8% |
| Immigrants | Eritrea | 5.4 /100 | #219 | Tragic 9.9% |
| Bermudans | 5.3 /100 | #220 | Tragic 9.9% |
| Immigrants | Cambodia | 4.8 /100 | #221 | Tragic 9.9% |
| Japanese | 4.8 /100 | #222 | Tragic 9.9% |
| Immigrants | Africa | 4.3 /100 | #223 | Tragic 9.9% |
| Marshallese | 3.9 /100 | #224 | Tragic 9.9% |
| Immigrants | Immigrants | 3.6 /100 | #225 | Tragic 10.0% |
| Ottawa | 3.3 /100 | #226 | Tragic 10.0% |