Iranian vs South American Indian Median Earnings
COMPARE
Iranian
South American Indian
Median Earnings
Median Earnings Comparison
Iranians
South American Indians
$58,474
MEDIAN EARNINGS
100.0/ 100
METRIC RATING
7th/ 347
METRIC RANK
$46,952
MEDIAN EARNINGS
67.4/ 100
METRIC RATING
162nd/ 347
METRIC RANK
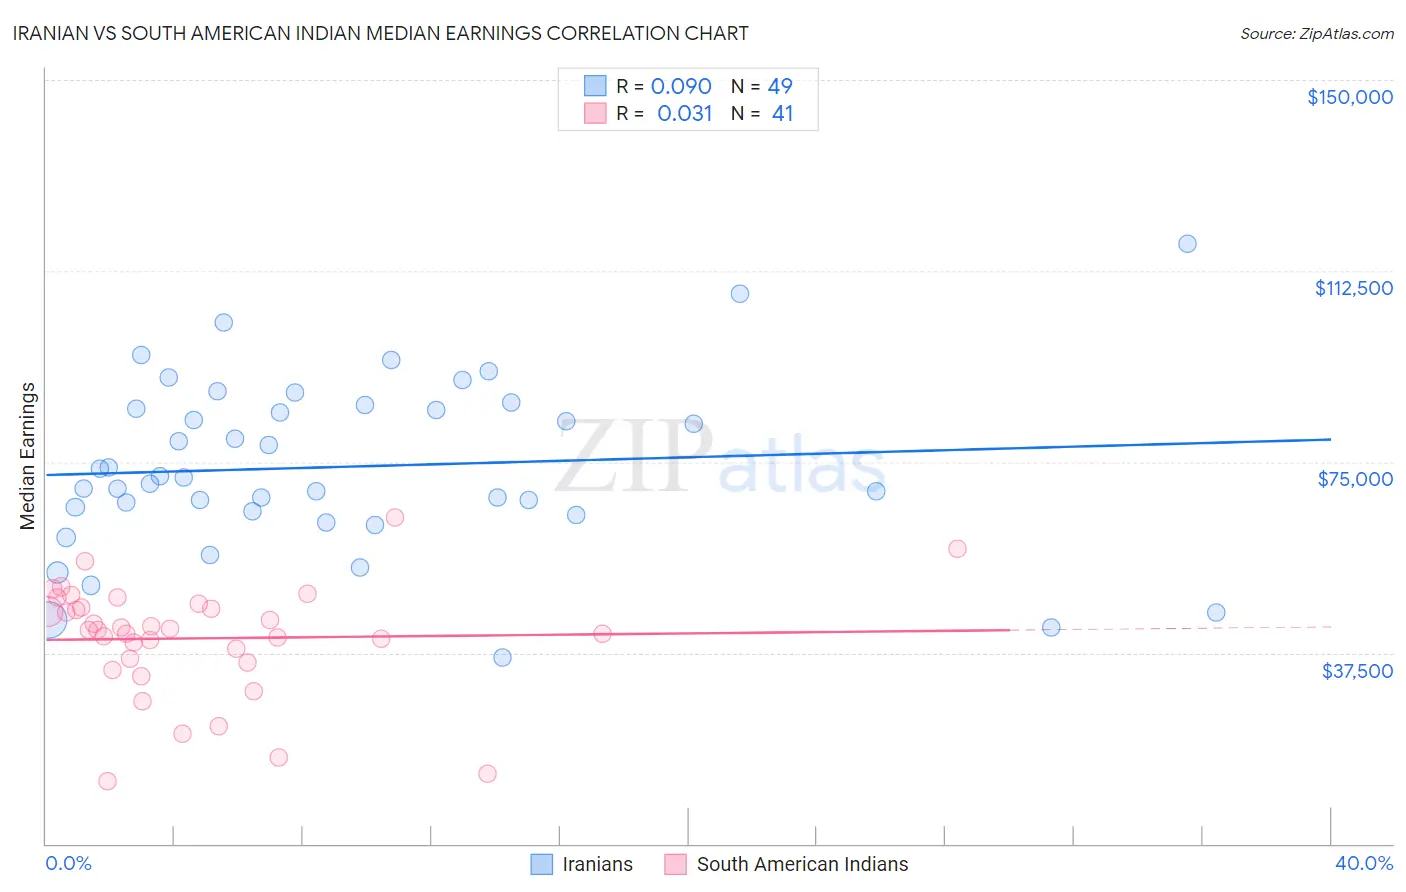
Iranian vs South American Indian Median Earnings Correlation Chart
The statistical analysis conducted on geographies consisting of 316,848,979 people shows a slight positive correlation between the proportion of Iranians and median earnings in the United States with a correlation coefficient (R) of 0.090 and weighted average of $58,474. Similarly, the statistical analysis conducted on geographies consisting of 164,566,845 people shows no correlation between the proportion of South American Indians and median earnings in the United States with a correlation coefficient (R) of 0.031 and weighted average of $46,952, a difference of 24.5%.
Median Earnings Correlation Summary
| Measurement | Iranian | South American Indian |
| Minimum | $36,458 | $12,289 |
| Maximum | $117,883 | $64,091 |
| Range | $81,425 | $51,802 |
| Mean | $74,068 | $40,352 |
| Median | $72,050 | $41,992 |
| Interquartile 25% (IQ1) | $64,975 | $35,978 |
| Interquartile 75% (IQ3) | $85,806 | $46,744 |
| Interquartile Range (IQR) | $20,831 | $10,766 |
| Standard Deviation (Sample) | $17,049 | $11,075 |
| Standard Deviation (Population) | $16,874 | $10,940 |
Similar Demographics by Median Earnings
Demographics Similar to Iranians by Median Earnings
In terms of median earnings, the demographic groups most similar to Iranians are Immigrants from Singapore ($59,038, a difference of 0.97%), Thai ($59,237, a difference of 1.3%), Immigrants from Iran ($57,612, a difference of 1.5%), Okinawan ($57,550, a difference of 1.6%), and Immigrants from Hong Kong ($59,433, a difference of 1.6%).
| Demographics | Rating | Rank | Median Earnings |
| Filipinos | 100.0 /100 | #1 | Exceptional $61,197 |
| Immigrants | Taiwan | 100.0 /100 | #2 | Exceptional $61,151 |
| Immigrants | India | 100.0 /100 | #3 | Exceptional $60,648 |
| Immigrants | Hong Kong | 100.0 /100 | #4 | Exceptional $59,433 |
| Thais | 100.0 /100 | #5 | Exceptional $59,237 |
| Immigrants | Singapore | 100.0 /100 | #6 | Exceptional $59,038 |
| Iranians | 100.0 /100 | #7 | Exceptional $58,474 |
| Immigrants | Iran | 100.0 /100 | #8 | Exceptional $57,612 |
| Okinawans | 100.0 /100 | #9 | Exceptional $57,550 |
| Immigrants | South Central Asia | 100.0 /100 | #10 | Exceptional $57,114 |
| Immigrants | Israel | 100.0 /100 | #11 | Exceptional $57,034 |
| Immigrants | Ireland | 100.0 /100 | #12 | Exceptional $56,854 |
| Immigrants | China | 100.0 /100 | #13 | Exceptional $56,638 |
| Immigrants | Australia | 100.0 /100 | #14 | Exceptional $56,305 |
| Indians (Asian) | 100.0 /100 | #15 | Exceptional $56,253 |
Demographics Similar to South American Indians by Median Earnings
In terms of median earnings, the demographic groups most similar to South American Indians are Immigrants from Eastern Africa ($46,969, a difference of 0.040%), Icelander ($46,916, a difference of 0.080%), Alsatian ($47,023, a difference of 0.15%), Immigrants from Peru ($47,025, a difference of 0.16%), and Norwegian ($46,865, a difference of 0.18%).
| Demographics | Rating | Rank | Median Earnings |
| Immigrants | Vietnam | 76.7 /100 | #155 | Good $47,282 |
| Irish | 76.6 /100 | #156 | Good $47,276 |
| Czechs | 75.1 /100 | #157 | Good $47,221 |
| Slovaks | 71.7 /100 | #158 | Good $47,095 |
| Immigrants | Peru | 69.6 /100 | #159 | Good $47,025 |
| Alsatians | 69.6 /100 | #160 | Good $47,023 |
| Immigrants | Eastern Africa | 68.0 /100 | #161 | Good $46,969 |
| South American Indians | 67.4 /100 | #162 | Good $46,952 |
| Icelanders | 66.3 /100 | #163 | Good $46,916 |
| Norwegians | 64.7 /100 | #164 | Good $46,865 |
| South Americans | 62.7 /100 | #165 | Good $46,804 |
| Czechoslovakians | 57.8 /100 | #166 | Average $46,658 |
| Costa Ricans | 57.4 /100 | #167 | Average $46,645 |
| Immigrants | Africa | 54.6 /100 | #168 | Average $46,564 |
| Immigrants | South America | 54.0 /100 | #169 | Average $46,548 |