Iranian vs South American Indian Disability Age 5 to 17
COMPARE
Iranian
South American Indian
Disability Age 5 to 17
Disability Age 5 to 17 Comparison
Iranians
South American Indians
4.6%
DISABILITY AGE 5 TO 17
100.0/ 100
METRIC RATING
12th/ 347
METRIC RANK
5.5%
DISABILITY AGE 5 TO 17
89.3/ 100
METRIC RATING
141st/ 347
METRIC RANK
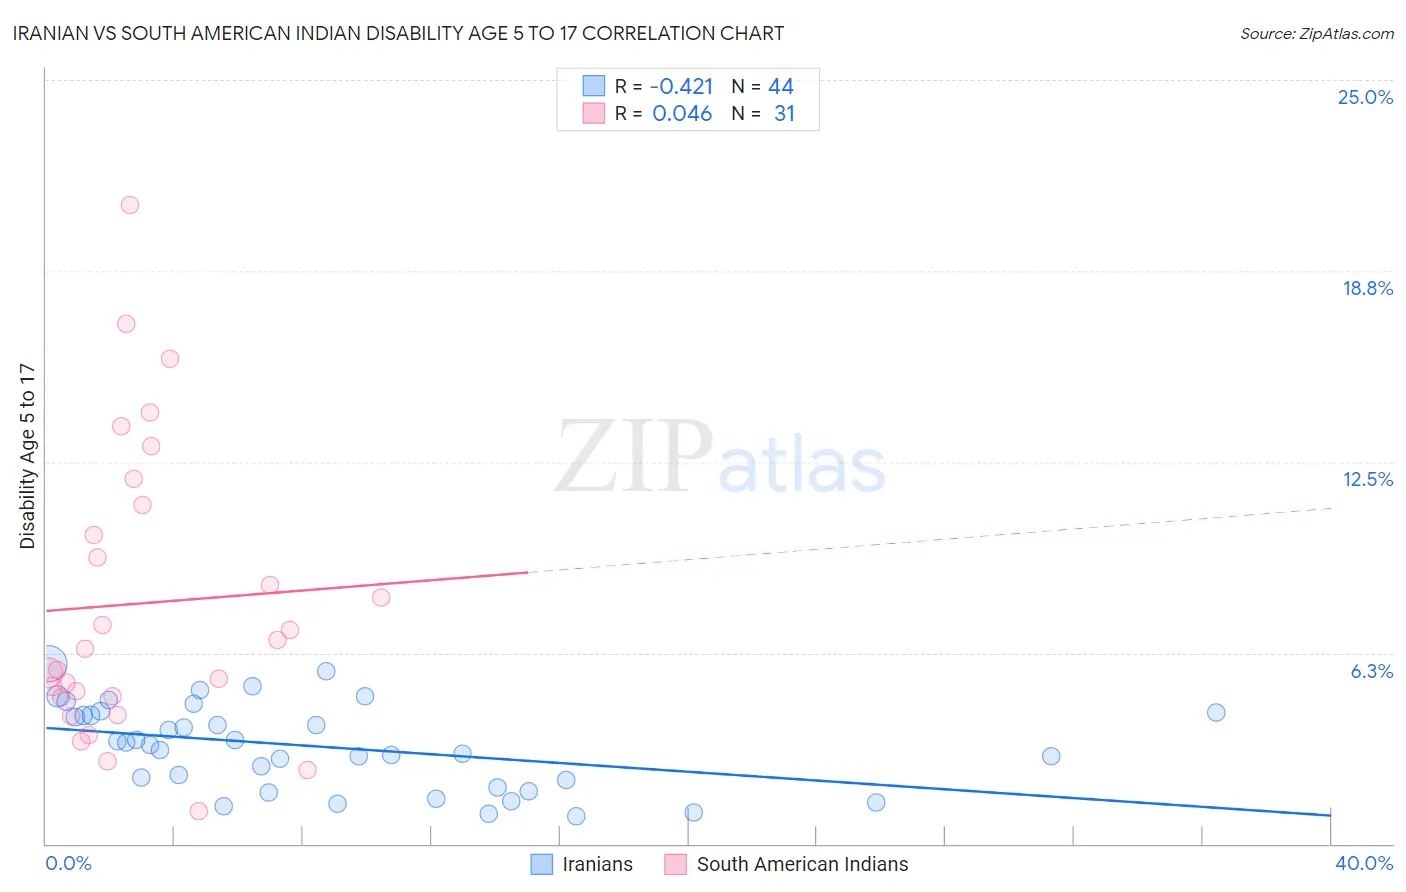
Iranian vs South American Indian Disability Age 5 to 17 Correlation Chart
The statistical analysis conducted on geographies consisting of 314,727,969 people shows a moderate negative correlation between the proportion of Iranians and percentage of population with a disability between the ages 5 and 17 in the United States with a correlation coefficient (R) of -0.421 and weighted average of 4.6%. Similarly, the statistical analysis conducted on geographies consisting of 164,285,003 people shows no correlation between the proportion of South American Indians and percentage of population with a disability between the ages 5 and 17 in the United States with a correlation coefficient (R) of 0.046 and weighted average of 5.5%, a difference of 18.5%.
Disability Age 5 to 17 Correlation Summary
| Measurement | Iranian | South American Indian |
| Minimum | 0.90% | 1.1% |
| Maximum | 5.9% | 20.9% |
| Range | 5.0% | 19.8% |
| Mean | 3.2% | 7.9% |
| Median | 3.3% | 6.4% |
| Interquartile 25% (IQ1) | 2.0% | 4.8% |
| Interquartile 75% (IQ3) | 4.2% | 11.1% |
| Interquartile Range (IQR) | 2.3% | 6.3% |
| Standard Deviation (Sample) | 1.4% | 4.8% |
| Standard Deviation (Population) | 1.4% | 4.7% |
Similar Demographics by Disability Age 5 to 17
Demographics Similar to Iranians by Disability Age 5 to 17
In terms of disability age 5 to 17, the demographic groups most similar to Iranians are Armenian (4.6%, a difference of 0.24%), Immigrants from India (4.6%, a difference of 0.40%), Immigrants from Eastern Asia (4.6%, a difference of 0.47%), Indian (Asian) (4.6%, a difference of 0.80%), and Thai (4.7%, a difference of 1.1%).
| Demographics | Rating | Rank | Disability Age 5 to 17 |
| Immigrants | Iran | 100.0 /100 | #5 | Exceptional 4.4% |
| Immigrants | Israel | 100.0 /100 | #6 | Exceptional 4.5% |
| Immigrants | China | 100.0 /100 | #7 | Exceptional 4.5% |
| Indians (Asian) | 100.0 /100 | #8 | Exceptional 4.6% |
| Immigrants | Eastern Asia | 100.0 /100 | #9 | Exceptional 4.6% |
| Immigrants | India | 100.0 /100 | #10 | Exceptional 4.6% |
| Armenians | 100.0 /100 | #11 | Exceptional 4.6% |
| Iranians | 100.0 /100 | #12 | Exceptional 4.6% |
| Thais | 100.0 /100 | #13 | Exceptional 4.7% |
| Immigrants | Korea | 100.0 /100 | #14 | Exceptional 4.7% |
| Chinese | 100.0 /100 | #15 | Exceptional 4.7% |
| Immigrants | Singapore | 100.0 /100 | #16 | Exceptional 4.7% |
| Arapaho | 100.0 /100 | #17 | Exceptional 4.7% |
| Immigrants | South Central Asia | 100.0 /100 | #18 | Exceptional 4.7% |
| Immigrants | Uzbekistan | 100.0 /100 | #19 | Exceptional 4.8% |
Demographics Similar to South American Indians by Disability Age 5 to 17
In terms of disability age 5 to 17, the demographic groups most similar to South American Indians are Colombian (5.5%, a difference of 0.15%), Immigrants from Netherlands (5.4%, a difference of 0.17%), Immigrants from Hungary (5.5%, a difference of 0.17%), Immigrants from Oceania (5.4%, a difference of 0.22%), and Belizean (5.4%, a difference of 0.22%).
| Demographics | Rating | Rank | Disability Age 5 to 17 |
| Yuman | 92.3 /100 | #134 | Exceptional 5.4% |
| Immigrants | Belize | 91.7 /100 | #135 | Exceptional 5.4% |
| Immigrants | Denmark | 91.4 /100 | #136 | Exceptional 5.4% |
| Navajo | 90.9 /100 | #137 | Exceptional 5.4% |
| Immigrants | Oceania | 90.8 /100 | #138 | Exceptional 5.4% |
| Belizeans | 90.8 /100 | #139 | Exceptional 5.4% |
| Immigrants | Netherlands | 90.5 /100 | #140 | Exceptional 5.4% |
| South American Indians | 89.3 /100 | #141 | Excellent 5.5% |
| Colombians | 88.0 /100 | #142 | Excellent 5.5% |
| Immigrants | Hungary | 87.9 /100 | #143 | Excellent 5.5% |
| Pakistanis | 87.3 /100 | #144 | Excellent 5.5% |
| Immigrants | Guatemala | 86.6 /100 | #145 | Excellent 5.5% |
| Albanians | 83.7 /100 | #146 | Excellent 5.5% |
| Immigrants | Albania | 83.1 /100 | #147 | Excellent 5.5% |
| Samoans | 81.9 /100 | #148 | Excellent 5.5% |