Iranian vs Chilean No Schooling Completed
COMPARE
Iranian
Chilean
No Schooling Completed
No Schooling Completed Comparison
Iranians
Chileans
1.8%
NO SCHOOLING COMPLETED
98.2/ 100
METRIC RATING
98th/ 347
METRIC RANK
2.0%
NO SCHOOLING COMPLETED
67.2/ 100
METRIC RATING
156th/ 347
METRIC RANK
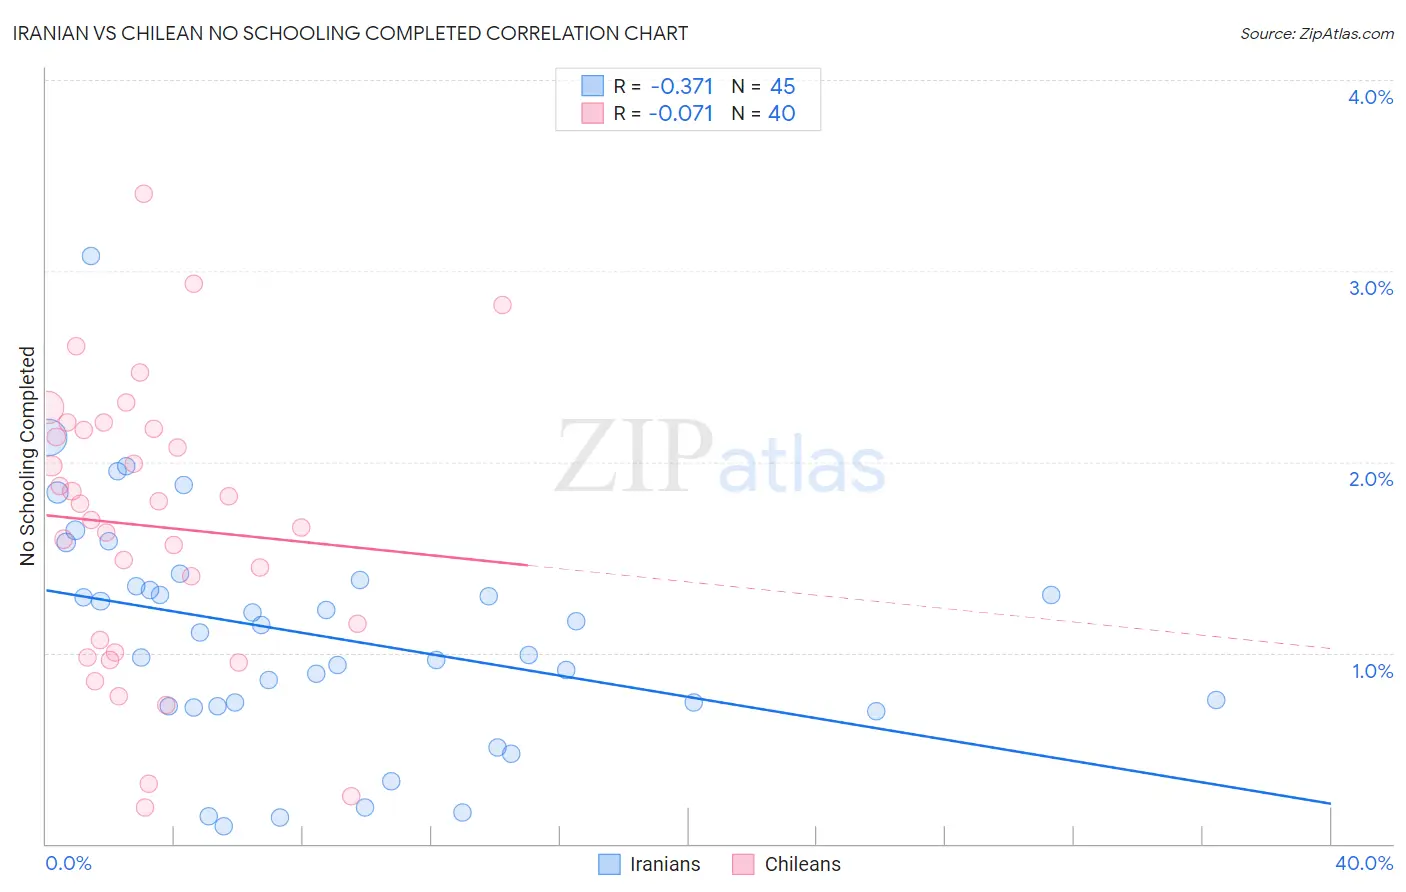
Iranian vs Chilean No Schooling Completed Correlation Chart
The statistical analysis conducted on geographies consisting of 314,406,519 people shows a mild negative correlation between the proportion of Iranians and percentage of population with no schooling in the United States with a correlation coefficient (R) of -0.371 and weighted average of 1.8%. Similarly, the statistical analysis conducted on geographies consisting of 255,430,535 people shows a slight negative correlation between the proportion of Chileans and percentage of population with no schooling in the United States with a correlation coefficient (R) of -0.071 and weighted average of 2.0%, a difference of 12.8%.
No Schooling Completed Correlation Summary
| Measurement | Iranian | Chilean |
| Minimum | 0.093% | 0.19% |
| Maximum | 3.1% | 3.4% |
| Range | 3.0% | 3.2% |
| Mean | 1.1% | 1.7% |
| Median | 1.1% | 1.7% |
| Interquartile 25% (IQ1) | 0.72% | 1.0% |
| Interquartile 75% (IQ3) | 1.4% | 2.2% |
| Interquartile Range (IQR) | 0.65% | 1.1% |
| Standard Deviation (Sample) | 0.60% | 0.74% |
| Standard Deviation (Population) | 0.60% | 0.73% |
Similar Demographics by No Schooling Completed
Demographics Similar to Iranians by No Schooling Completed
In terms of no schooling completed, the demographic groups most similar to Iranians are Choctaw (1.8%, a difference of 0.19%), Immigrants from Ireland (1.8%, a difference of 0.28%), Immigrants from Singapore (1.8%, a difference of 0.39%), Bhutanese (1.8%, a difference of 0.46%), and Immigrants from Czechoslovakia (1.8%, a difference of 0.68%).
| Demographics | Rating | Rank | No Schooling Completed |
| Immigrants | Germany | 99.0 /100 | #91 | Exceptional 1.8% |
| Romanians | 98.8 /100 | #92 | Exceptional 1.8% |
| Turks | 98.7 /100 | #93 | Exceptional 1.8% |
| Immigrants | Nonimmigrants | 98.5 /100 | #94 | Exceptional 1.8% |
| Puget Sound Salish | 98.5 /100 | #95 | Exceptional 1.8% |
| Bhutanese | 98.4 /100 | #96 | Exceptional 1.8% |
| Immigrants | Ireland | 98.4 /100 | #97 | Exceptional 1.8% |
| Iranians | 98.2 /100 | #98 | Exceptional 1.8% |
| Choctaw | 98.1 /100 | #99 | Exceptional 1.8% |
| Immigrants | Singapore | 98.0 /100 | #100 | Exceptional 1.8% |
| Immigrants | Czechoslovakia | 97.9 /100 | #101 | Exceptional 1.8% |
| Immigrants | Switzerland | 97.9 /100 | #102 | Exceptional 1.8% |
| Basques | 97.9 /100 | #103 | Exceptional 1.8% |
| Thais | 97.5 /100 | #104 | Exceptional 1.8% |
| German Russians | 97.5 /100 | #105 | Exceptional 1.8% |
Demographics Similar to Chileans by No Schooling Completed
In terms of no schooling completed, the demographic groups most similar to Chileans are Immigrants from Sri Lanka (2.0%, a difference of 0.030%), Immigrants from Russia (2.0%, a difference of 0.070%), Immigrants from Korea (2.0%, a difference of 0.080%), Immigrants from Spain (2.0%, a difference of 0.12%), and Immigrants from Venezuela (2.0%, a difference of 0.21%).
| Demographics | Rating | Rank | No Schooling Completed |
| Immigrants | North Macedonia | 75.9 /100 | #149 | Good 2.0% |
| Blackfeet | 72.9 /100 | #150 | Good 2.0% |
| Immigrants | Jordan | 70.9 /100 | #151 | Good 2.0% |
| Immigrants | Eastern Europe | 70.4 /100 | #152 | Good 2.0% |
| Immigrants | Italy | 68.9 /100 | #153 | Good 2.0% |
| Immigrants | Venezuela | 68.5 /100 | #154 | Good 2.0% |
| Immigrants | Russia | 67.6 /100 | #155 | Good 2.0% |
| Chileans | 67.2 /100 | #156 | Good 2.0% |
| Immigrants | Sri Lanka | 67.0 /100 | #157 | Good 2.0% |
| Immigrants | Korea | 66.7 /100 | #158 | Good 2.0% |
| Immigrants | Spain | 66.4 /100 | #159 | Good 2.0% |
| Kenyans | 65.7 /100 | #160 | Good 2.0% |
| Ugandans | 64.6 /100 | #161 | Good 2.0% |
| Immigrants | Brazil | 63.8 /100 | #162 | Good 2.1% |
| Albanians | 62.2 /100 | #163 | Good 2.1% |