French Canadian vs Chilean Single Mother Poverty
COMPARE
French Canadian
Chilean
Single Mother Poverty
Single Mother Poverty Comparison
French Canadians
Chileans
30.8%
SINGLE MOTHER POVERTY
0.9/ 100
METRIC RATING
248th/ 347
METRIC RANK
27.9%
SINGLE MOTHER POVERTY
97.5/ 100
METRIC RATING
95th/ 347
METRIC RANK
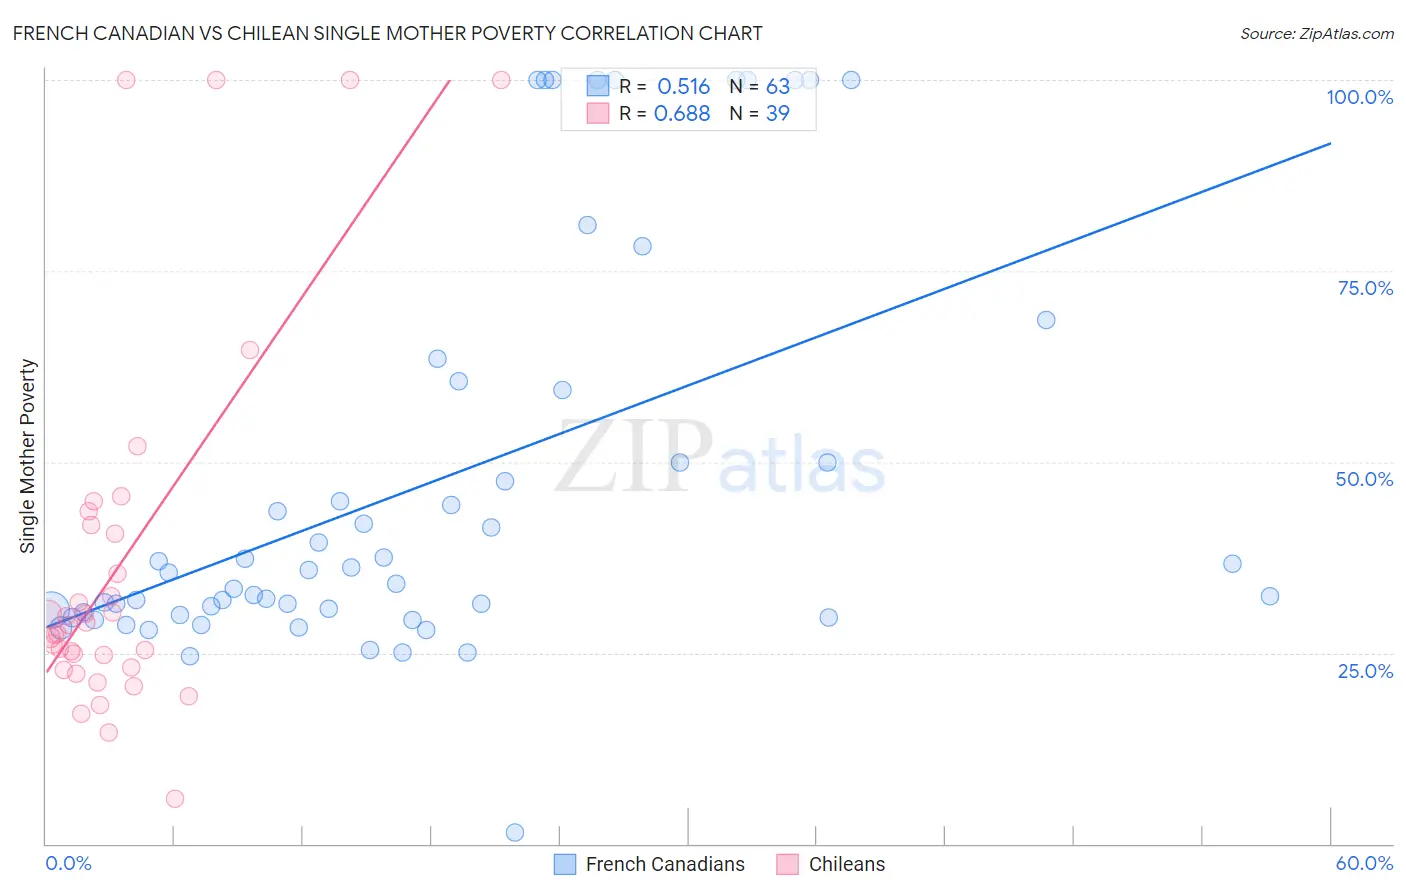
French Canadian vs Chilean Single Mother Poverty Correlation Chart
The statistical analysis conducted on geographies consisting of 483,193,391 people shows a substantial positive correlation between the proportion of French Canadians and poverty level among single mothers in the United States with a correlation coefficient (R) of 0.516 and weighted average of 30.8%. Similarly, the statistical analysis conducted on geographies consisting of 252,857,793 people shows a significant positive correlation between the proportion of Chileans and poverty level among single mothers in the United States with a correlation coefficient (R) of 0.688 and weighted average of 27.9%, a difference of 10.5%.
Single Mother Poverty Correlation Summary
| Measurement | French Canadian | Chilean |
| Minimum | 1.5% | 5.9% |
| Maximum | 100.0% | 100.0% |
| Range | 98.5% | 94.1% |
| Mean | 47.1% | 36.6% |
| Median | 35.6% | 28.7% |
| Interquartile 25% (IQ1) | 29.9% | 23.1% |
| Interquartile 75% (IQ3) | 59.4% | 41.7% |
| Interquartile Range (IQR) | 29.5% | 18.5% |
| Standard Deviation (Sample) | 26.4% | 24.2% |
| Standard Deviation (Population) | 26.2% | 23.9% |
Similar Demographics by Single Mother Poverty
Demographics Similar to French Canadians by Single Mother Poverty
In terms of single mother poverty, the demographic groups most similar to French Canadians are West Indian (30.8%, a difference of 0.040%), Ecuadorian (30.8%, a difference of 0.080%), Cape Verdean (30.8%, a difference of 0.080%), Vietnamese (30.9%, a difference of 0.22%), and Tlingit-Haida (30.9%, a difference of 0.35%).
| Demographics | Rating | Rank | Single Mother Poverty |
| Immigrants | Laos | 1.8 /100 | #241 | Tragic 30.6% |
| Immigrants | Burma/Myanmar | 1.7 /100 | #242 | Tragic 30.6% |
| Bermudans | 1.6 /100 | #243 | Tragic 30.6% |
| French | 1.3 /100 | #244 | Tragic 30.7% |
| Barbadians | 1.3 /100 | #245 | Tragic 30.7% |
| Ecuadorians | 0.9 /100 | #246 | Tragic 30.8% |
| West Indians | 0.9 /100 | #247 | Tragic 30.8% |
| French Canadians | 0.9 /100 | #248 | Tragic 30.8% |
| Cape Verdeans | 0.8 /100 | #249 | Tragic 30.8% |
| Vietnamese | 0.7 /100 | #250 | Tragic 30.9% |
| Tlingit-Haida | 0.6 /100 | #251 | Tragic 30.9% |
| Alaska Natives | 0.6 /100 | #252 | Tragic 30.9% |
| Celtics | 0.6 /100 | #253 | Tragic 30.9% |
| Senegalese | 0.5 /100 | #254 | Tragic 31.0% |
| Belizeans | 0.5 /100 | #255 | Tragic 31.0% |
Demographics Similar to Chileans by Single Mother Poverty
In terms of single mother poverty, the demographic groups most similar to Chileans are Albanian (27.9%, a difference of 0.030%), Immigrants from Iraq (27.9%, a difference of 0.10%), Romanian (27.8%, a difference of 0.13%), Immigrants from Brazil (27.9%, a difference of 0.14%), and Immigrants from Nepal (27.9%, a difference of 0.15%).
| Demographics | Rating | Rank | Single Mother Poverty |
| Ethiopians | 98.4 /100 | #88 | Exceptional 27.7% |
| Immigrants | Ethiopia | 98.4 /100 | #89 | Exceptional 27.7% |
| Immigrants | France | 98.2 /100 | #90 | Exceptional 27.8% |
| Immigrants | Albania | 98.0 /100 | #91 | Exceptional 27.8% |
| Estonians | 97.9 /100 | #92 | Exceptional 27.8% |
| Romanians | 97.8 /100 | #93 | Exceptional 27.8% |
| Albanians | 97.6 /100 | #94 | Exceptional 27.9% |
| Chileans | 97.5 /100 | #95 | Exceptional 27.9% |
| Immigrants | Iraq | 97.3 /100 | #96 | Exceptional 27.9% |
| Immigrants | Brazil | 97.2 /100 | #97 | Exceptional 27.9% |
| Immigrants | Nepal | 97.2 /100 | #98 | Exceptional 27.9% |
| Immigrants | Netherlands | 97.2 /100 | #99 | Exceptional 27.9% |
| Zimbabweans | 97.1 /100 | #100 | Exceptional 27.9% |
| Pakistanis | 96.9 /100 | #101 | Exceptional 28.0% |
| Immigrants | Croatia | 96.7 /100 | #102 | Exceptional 28.0% |