Immigrants from South Eastern Asia vs Immigrants from Eastern Asia Female Poverty
COMPARE
Immigrants from South Eastern Asia
Immigrants from Eastern Asia
Female Poverty
Female Poverty Comparison
Immigrants from South Eastern Asia
Immigrants from Eastern Asia
12.7%
FEMALE POVERTY
89.9/ 100
METRIC RATING
123rd/ 347
METRIC RANK
12.2%
FEMALE POVERTY
97.8/ 100
METRIC RATING
67th/ 347
METRIC RANK
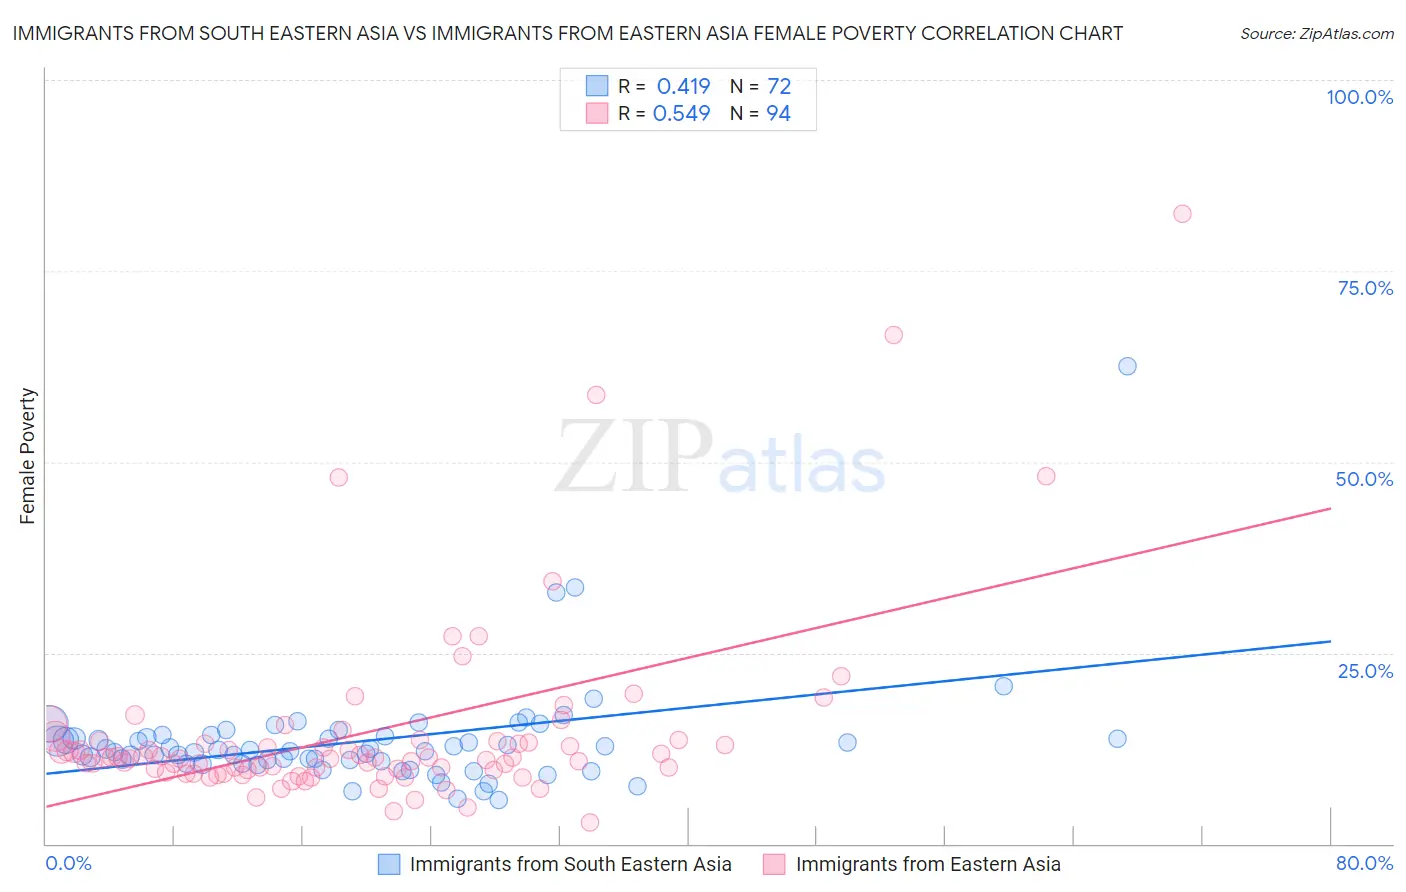
Immigrants from South Eastern Asia vs Immigrants from Eastern Asia Female Poverty Correlation Chart
The statistical analysis conducted on geographies consisting of 512,071,275 people shows a moderate positive correlation between the proportion of Immigrants from South Eastern Asia and poverty level among females in the United States with a correlation coefficient (R) of 0.419 and weighted average of 12.7%. Similarly, the statistical analysis conducted on geographies consisting of 499,182,216 people shows a substantial positive correlation between the proportion of Immigrants from Eastern Asia and poverty level among females in the United States with a correlation coefficient (R) of 0.549 and weighted average of 12.2%, a difference of 4.3%.
Female Poverty Correlation Summary
| Measurement | Immigrants from South Eastern Asia | Immigrants from Eastern Asia |
| Minimum | 5.8% | 2.9% |
| Maximum | 62.5% | 82.5% |
| Range | 56.7% | 79.7% |
| Mean | 13.4% | 14.5% |
| Median | 12.2% | 11.3% |
| Interquartile 25% (IQ1) | 10.6% | 9.7% |
| Interquartile 75% (IQ3) | 14.0% | 13.5% |
| Interquartile Range (IQR) | 3.4% | 3.8% |
| Standard Deviation (Sample) | 7.4% | 12.4% |
| Standard Deviation (Population) | 7.3% | 12.3% |
Similar Demographics by Female Poverty
Demographics Similar to Immigrants from South Eastern Asia by Female Poverty
In terms of female poverty, the demographic groups most similar to Immigrants from South Eastern Asia are French Canadian (12.7%, a difference of 0.070%), Immigrants from Hungary (12.7%, a difference of 0.10%), Immigrants from Norway (12.8%, a difference of 0.18%), New Zealander (12.7%, a difference of 0.21%), and Argentinean (12.8%, a difference of 0.23%).
| Demographics | Rating | Rank | Female Poverty |
| Immigrants | Russia | 91.2 /100 | #116 | Exceptional 12.7% |
| Immigrants | Southern Europe | 90.9 /100 | #117 | Exceptional 12.7% |
| Sri Lankans | 90.9 /100 | #118 | Exceptional 12.7% |
| Albanians | 90.8 /100 | #119 | Exceptional 12.7% |
| New Zealanders | 90.6 /100 | #120 | Exceptional 12.7% |
| Immigrants | Hungary | 90.3 /100 | #121 | Exceptional 12.7% |
| French Canadians | 90.2 /100 | #122 | Exceptional 12.7% |
| Immigrants | South Eastern Asia | 89.9 /100 | #123 | Excellent 12.7% |
| Immigrants | Norway | 89.3 /100 | #124 | Excellent 12.8% |
| Argentineans | 89.1 /100 | #125 | Excellent 12.8% |
| Immigrants | Ukraine | 88.8 /100 | #126 | Excellent 12.8% |
| South Africans | 88.4 /100 | #127 | Excellent 12.8% |
| Immigrants | Belarus | 88.2 /100 | #128 | Excellent 12.8% |
| Immigrants | Brazil | 87.9 /100 | #129 | Excellent 12.8% |
| Immigrants | Vietnam | 87.1 /100 | #130 | Excellent 12.8% |
Demographics Similar to Immigrants from Eastern Asia by Female Poverty
In terms of female poverty, the demographic groups most similar to Immigrants from Eastern Asia are Immigrants from Netherlands (12.2%, a difference of 0.040%), Austrian (12.2%, a difference of 0.13%), Indian (Asian) (12.2%, a difference of 0.14%), Swiss (12.2%, a difference of 0.14%), and German (12.2%, a difference of 0.17%).
| Demographics | Rating | Rank | Female Poverty |
| Immigrants | Australia | 98.1 /100 | #60 | Exceptional 12.2% |
| Immigrants | Asia | 98.1 /100 | #61 | Exceptional 12.2% |
| Immigrants | Italy | 98.0 /100 | #62 | Exceptional 12.2% |
| Ukrainians | 98.0 /100 | #63 | Exceptional 12.2% |
| Germans | 98.0 /100 | #64 | Exceptional 12.2% |
| Indians (Asian) | 97.9 /100 | #65 | Exceptional 12.2% |
| Austrians | 97.9 /100 | #66 | Exceptional 12.2% |
| Immigrants | Eastern Asia | 97.8 /100 | #67 | Exceptional 12.2% |
| Immigrants | Netherlands | 97.8 /100 | #68 | Exceptional 12.2% |
| Swiss | 97.7 /100 | #69 | Exceptional 12.2% |
| Immigrants | Belgium | 97.7 /100 | #70 | Exceptional 12.2% |
| Carpatho Rusyns | 97.6 /100 | #71 | Exceptional 12.2% |
| Cambodians | 97.5 /100 | #72 | Exceptional 12.2% |
| Zimbabweans | 97.5 /100 | #73 | Exceptional 12.3% |
| Immigrants | Canada | 97.5 /100 | #74 | Exceptional 12.3% |