Immigrants from Western Africa vs Immigrants from Mexico Births to Unmarried Women
COMPARE
Immigrants from Western Africa
Immigrants from Mexico
Births to Unmarried Women
Births to Unmarried Women Comparison
Immigrants from Western Africa
Immigrants from Mexico
36.0%
BIRTHS TO UNMARRIED WOMEN
0.3/ 100
METRIC RATING
251st/ 347
METRIC RANK
37.5%
BIRTHS TO UNMARRIED WOMEN
0.0/ 100
METRIC RATING
285th/ 347
METRIC RANK
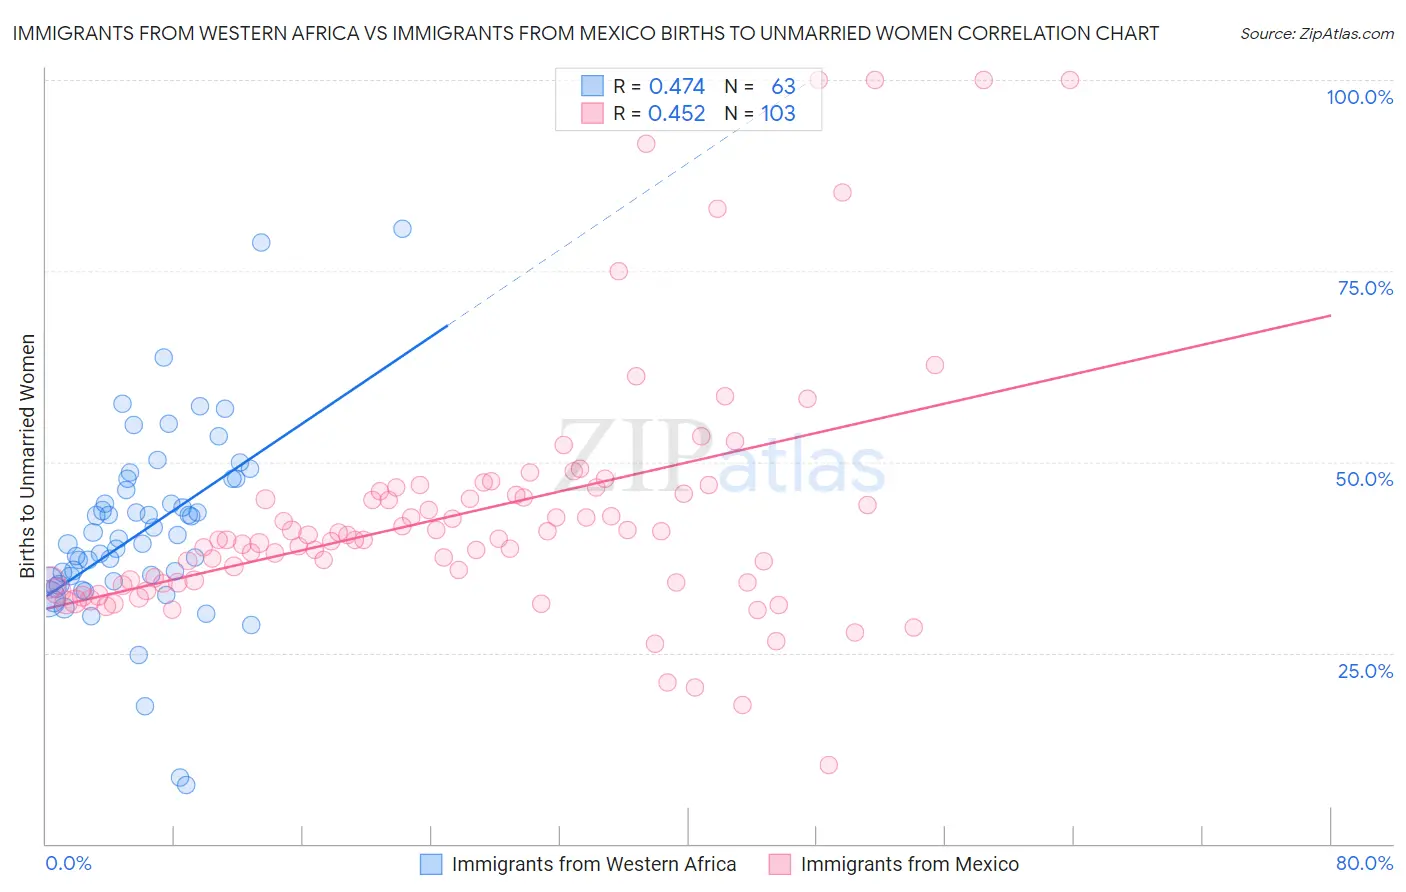
Immigrants from Western Africa vs Immigrants from Mexico Births to Unmarried Women Correlation Chart
The statistical analysis conducted on geographies consisting of 339,836,557 people shows a moderate positive correlation between the proportion of Immigrants from Western Africa and percentage of births to unmarried women in the United States with a correlation coefficient (R) of 0.474 and weighted average of 36.0%. Similarly, the statistical analysis conducted on geographies consisting of 469,807,529 people shows a moderate positive correlation between the proportion of Immigrants from Mexico and percentage of births to unmarried women in the United States with a correlation coefficient (R) of 0.452 and weighted average of 37.5%, a difference of 4.2%.
Births to Unmarried Women Correlation Summary
| Measurement | Immigrants from Western Africa | Immigrants from Mexico |
| Minimum | 7.8% | 10.3% |
| Maximum | 80.6% | 100.0% |
| Range | 72.8% | 89.7% |
| Mean | 41.0% | 43.3% |
| Median | 39.9% | 39.8% |
| Interquartile 25% (IQ1) | 34.3% | 34.2% |
| Interquartile 75% (IQ3) | 47.8% | 46.2% |
| Interquartile Range (IQR) | 13.5% | 12.0% |
| Standard Deviation (Sample) | 12.4% | 16.6% |
| Standard Deviation (Population) | 12.3% | 16.5% |
Similar Demographics by Births to Unmarried Women
Demographics Similar to Immigrants from Western Africa by Births to Unmarried Women
In terms of births to unmarried women, the demographic groups most similar to Immigrants from Western Africa are Salvadoran (36.0%, a difference of 0.12%), Mexican American Indian (35.7%, a difference of 0.57%), Immigrants from Portugal (36.2%, a difference of 0.58%), Potawatomi (36.2%, a difference of 0.81%), and Chickasaw (36.3%, a difference of 0.95%).
| Demographics | Rating | Rank | Births to Unmarried Women |
| Guyanese | 0.9 /100 | #244 | Tragic 35.2% |
| Shoshone | 0.8 /100 | #245 | Tragic 35.3% |
| Nigerians | 0.7 /100 | #246 | Tragic 35.3% |
| Immigrants | Nigeria | 0.7 /100 | #247 | Tragic 35.4% |
| Immigrants | Nonimmigrants | 0.6 /100 | #248 | Tragic 35.5% |
| Bermudans | 0.6 /100 | #249 | Tragic 35.5% |
| Mexican American Indians | 0.4 /100 | #250 | Tragic 35.7% |
| Immigrants | Western Africa | 0.3 /100 | #251 | Tragic 36.0% |
| Salvadorans | 0.3 /100 | #252 | Tragic 36.0% |
| Immigrants | Portugal | 0.2 /100 | #253 | Tragic 36.2% |
| Potawatomi | 0.2 /100 | #254 | Tragic 36.2% |
| Chickasaw | 0.2 /100 | #255 | Tragic 36.3% |
| Immigrants | Trinidad and Tobago | 0.2 /100 | #256 | Tragic 36.3% |
| Immigrants | Grenada | 0.2 /100 | #257 | Tragic 36.3% |
| Americans | 0.2 /100 | #258 | Tragic 36.4% |
Demographics Similar to Immigrants from Mexico by Births to Unmarried Women
In terms of births to unmarried women, the demographic groups most similar to Immigrants from Mexico are Immigrants from Guatemala (37.5%, a difference of 0.010%), Immigrants from Central America (37.4%, a difference of 0.10%), Spanish American Indian (37.4%, a difference of 0.16%), Liberian (37.4%, a difference of 0.24%), and Creek (37.6%, a difference of 0.25%).
| Demographics | Rating | Rank | Births to Unmarried Women |
| Immigrants | Latin America | 0.1 /100 | #278 | Tragic 37.1% |
| West Indians | 0.1 /100 | #279 | Tragic 37.3% |
| Immigrants | St. Vincent and the Grenadines | 0.1 /100 | #280 | Tragic 37.3% |
| Immigrants | Belize | 0.1 /100 | #281 | Tragic 37.3% |
| Liberians | 0.0 /100 | #282 | Tragic 37.4% |
| Spanish American Indians | 0.0 /100 | #283 | Tragic 37.4% |
| Immigrants | Central America | 0.0 /100 | #284 | Tragic 37.4% |
| Immigrants | Mexico | 0.0 /100 | #285 | Tragic 37.5% |
| Immigrants | Guatemala | 0.0 /100 | #286 | Tragic 37.5% |
| Creek | 0.0 /100 | #287 | Tragic 37.6% |
| Immigrants | Liberia | 0.0 /100 | #288 | Tragic 37.6% |
| Alaskan Athabascans | 0.0 /100 | #289 | Tragic 37.7% |
| Hispanics or Latinos | 0.0 /100 | #290 | Tragic 37.8% |
| Seminole | 0.0 /100 | #291 | Tragic 37.9% |
| Blackfeet | 0.0 /100 | #292 | Tragic 37.9% |