Immigrants from Uzbekistan vs Immigrants from Cameroon Single Father Poverty
COMPARE
Immigrants from Uzbekistan
Immigrants from Cameroon
Single Father Poverty
Single Father Poverty Comparison
Immigrants from Uzbekistan
Immigrants from Cameroon
15.0%
SINGLE FATHER POVERTY
99.9/ 100
METRIC RATING
54th/ 347
METRIC RANK
15.2%
SINGLE FATHER POVERTY
99.7/ 100
METRIC RATING
68th/ 347
METRIC RANK
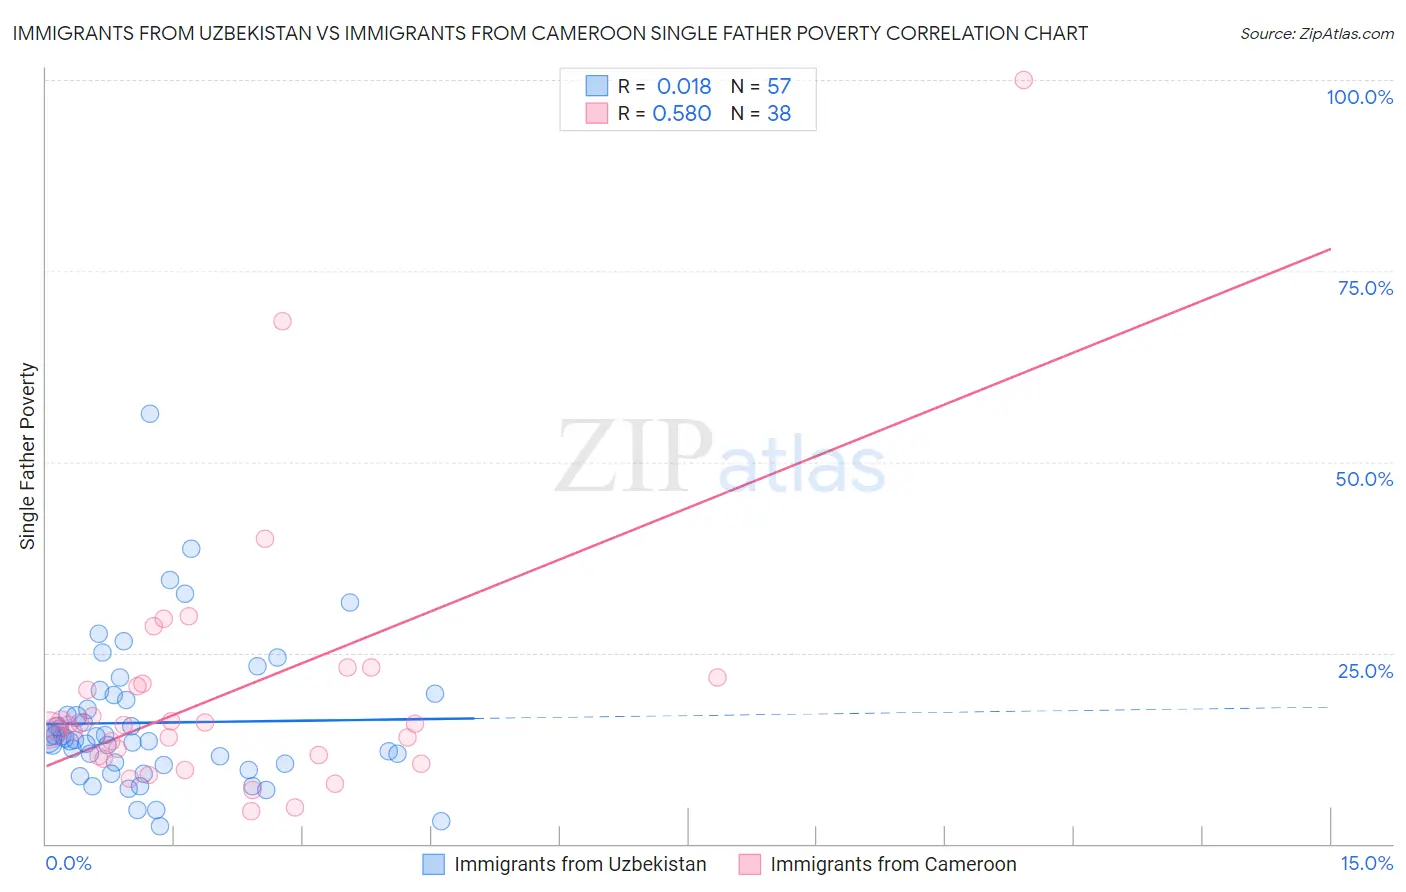
Immigrants from Uzbekistan vs Immigrants from Cameroon Single Father Poverty Correlation Chart
The statistical analysis conducted on geographies consisting of 104,243,458 people shows no correlation between the proportion of Immigrants from Uzbekistan and poverty level among single fathers in the United States with a correlation coefficient (R) of 0.018 and weighted average of 15.0%. Similarly, the statistical analysis conducted on geographies consisting of 118,461,150 people shows a substantial positive correlation between the proportion of Immigrants from Cameroon and poverty level among single fathers in the United States with a correlation coefficient (R) of 0.580 and weighted average of 15.2%, a difference of 1.5%.
Single Father Poverty Correlation Summary
| Measurement | Immigrants from Uzbekistan | Immigrants from Cameroon |
| Minimum | 2.4% | 4.2% |
| Maximum | 56.2% | 100.0% |
| Range | 53.9% | 95.8% |
| Mean | 15.8% | 19.7% |
| Median | 13.8% | 15.6% |
| Interquartile 25% (IQ1) | 10.4% | 11.5% |
| Interquartile 75% (IQ3) | 19.1% | 20.9% |
| Interquartile Range (IQR) | 8.7% | 9.4% |
| Standard Deviation (Sample) | 9.4% | 17.5% |
| Standard Deviation (Population) | 9.3% | 17.2% |
Demographics Similar to Immigrants from Uzbekistan and Immigrants from Cameroon by Single Father Poverty
In terms of single father poverty, the demographic groups most similar to Immigrants from Uzbekistan are Immigrants from Bulgaria (15.0%, a difference of 0.050%), Immigrants from Kenya (15.0%, a difference of 0.18%), Immigrants from El Salvador (15.0%, a difference of 0.22%), Immigrants from Pakistan (15.0%, a difference of 0.26%), and Immigrants from Laos (15.1%, a difference of 0.32%). Similarly, the demographic groups most similar to Immigrants from Cameroon are Japanese (15.2%, a difference of 0.030%), Paraguayan (15.2%, a difference of 0.090%), Mongolian (15.3%, a difference of 0.13%), Immigrants from Moldova (15.2%, a difference of 0.18%), and Immigrants from Malaysia (15.2%, a difference of 0.20%).
| Demographics | Rating | Rank | Single Father Poverty |
| Immigrants | Pakistan | 99.9 /100 | #51 | Exceptional 15.0% |
| Immigrants | El Salvador | 99.9 /100 | #52 | Exceptional 15.0% |
| Immigrants | Kenya | 99.9 /100 | #53 | Exceptional 15.0% |
| Immigrants | Uzbekistan | 99.9 /100 | #54 | Exceptional 15.0% |
| Immigrants | Bulgaria | 99.9 /100 | #55 | Exceptional 15.0% |
| Immigrants | Laos | 99.9 /100 | #56 | Exceptional 15.1% |
| Laotians | 99.9 /100 | #57 | Exceptional 15.1% |
| Hawaiians | 99.9 /100 | #58 | Exceptional 15.1% |
| Guamanians/Chamorros | 99.9 /100 | #59 | Exceptional 15.1% |
| Puget Sound Salish | 99.8 /100 | #60 | Exceptional 15.2% |
| Immigrants | Bosnia and Herzegovina | 99.8 /100 | #61 | Exceptional 15.2% |
| Immigrants | Armenia | 99.8 /100 | #62 | Exceptional 15.2% |
| Immigrants | Sweden | 99.8 /100 | #63 | Exceptional 15.2% |
| Bangladeshis | 99.8 /100 | #64 | Exceptional 15.2% |
| Immigrants | Malaysia | 99.8 /100 | #65 | Exceptional 15.2% |
| Immigrants | Moldova | 99.8 /100 | #66 | Exceptional 15.2% |
| Paraguayans | 99.7 /100 | #67 | Exceptional 15.2% |
| Immigrants | Cameroon | 99.7 /100 | #68 | Exceptional 15.2% |
| Japanese | 99.7 /100 | #69 | Exceptional 15.2% |
| Mongolians | 99.7 /100 | #70 | Exceptional 15.3% |
| Immigrants | Brazil | 99.6 /100 | #71 | Exceptional 15.3% |