Immigrants from Uzbekistan vs Ghanaian Single Father Poverty
COMPARE
Immigrants from Uzbekistan
Ghanaian
Single Father Poverty
Single Father Poverty Comparison
Immigrants from Uzbekistan
Ghanaians
15.0%
SINGLE FATHER POVERTY
99.9/ 100
METRIC RATING
54th/ 347
METRIC RANK
16.7%
SINGLE FATHER POVERTY
11.0/ 100
METRIC RATING
213th/ 347
METRIC RANK
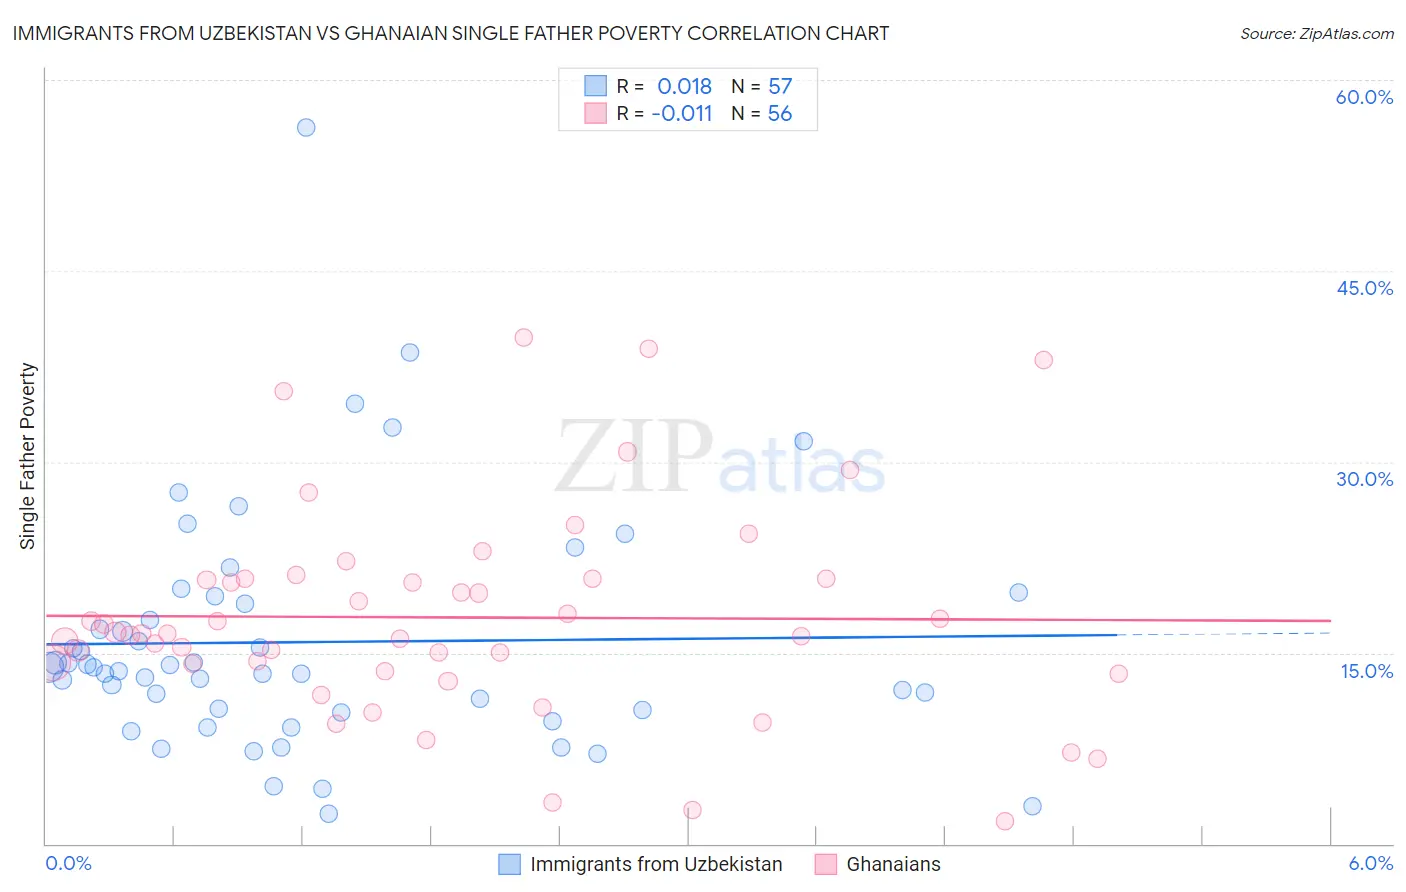
Immigrants from Uzbekistan vs Ghanaian Single Father Poverty Correlation Chart
The statistical analysis conducted on geographies consisting of 104,243,458 people shows no correlation between the proportion of Immigrants from Uzbekistan and poverty level among single fathers in the United States with a correlation coefficient (R) of 0.018 and weighted average of 15.0%. Similarly, the statistical analysis conducted on geographies consisting of 166,273,707 people shows no correlation between the proportion of Ghanaians and poverty level among single fathers in the United States with a correlation coefficient (R) of -0.011 and weighted average of 16.7%, a difference of 11.1%.
Single Father Poverty Correlation Summary
| Measurement | Immigrants from Uzbekistan | Ghanaian |
| Minimum | 2.4% | 1.7% |
| Maximum | 56.2% | 39.8% |
| Range | 53.9% | 38.1% |
| Mean | 15.8% | 17.8% |
| Median | 13.8% | 16.5% |
| Interquartile 25% (IQ1) | 10.4% | 13.8% |
| Interquartile 75% (IQ3) | 19.1% | 20.8% |
| Interquartile Range (IQR) | 8.7% | 7.0% |
| Standard Deviation (Sample) | 9.4% | 8.2% |
| Standard Deviation (Population) | 9.3% | 8.2% |
Similar Demographics by Single Father Poverty
Demographics Similar to Immigrants from Uzbekistan by Single Father Poverty
In terms of single father poverty, the demographic groups most similar to Immigrants from Uzbekistan are Immigrants from Bulgaria (15.0%, a difference of 0.050%), Immigrants from Kenya (15.0%, a difference of 0.18%), Immigrants from El Salvador (15.0%, a difference of 0.22%), Immigrants from Pakistan (15.0%, a difference of 0.26%), and Bhutanese (15.0%, a difference of 0.27%).
| Demographics | Rating | Rank | Single Father Poverty |
| Immigrants | China | 99.9 /100 | #47 | Exceptional 14.9% |
| Malaysians | 99.9 /100 | #48 | Exceptional 14.9% |
| Immigrants | Eastern Asia | 99.9 /100 | #49 | Exceptional 15.0% |
| Bhutanese | 99.9 /100 | #50 | Exceptional 15.0% |
| Immigrants | Pakistan | 99.9 /100 | #51 | Exceptional 15.0% |
| Immigrants | El Salvador | 99.9 /100 | #52 | Exceptional 15.0% |
| Immigrants | Kenya | 99.9 /100 | #53 | Exceptional 15.0% |
| Immigrants | Uzbekistan | 99.9 /100 | #54 | Exceptional 15.0% |
| Immigrants | Bulgaria | 99.9 /100 | #55 | Exceptional 15.0% |
| Immigrants | Laos | 99.9 /100 | #56 | Exceptional 15.1% |
| Laotians | 99.9 /100 | #57 | Exceptional 15.1% |
| Hawaiians | 99.9 /100 | #58 | Exceptional 15.1% |
| Guamanians/Chamorros | 99.9 /100 | #59 | Exceptional 15.1% |
| Puget Sound Salish | 99.8 /100 | #60 | Exceptional 15.2% |
| Immigrants | Bosnia and Herzegovina | 99.8 /100 | #61 | Exceptional 15.2% |
Demographics Similar to Ghanaians by Single Father Poverty
In terms of single father poverty, the demographic groups most similar to Ghanaians are Immigrants from Southern Europe (16.7%, a difference of 0.020%), Spanish (16.7%, a difference of 0.040%), Immigrants from Scotland (16.7%, a difference of 0.17%), Immigrants from England (16.7%, a difference of 0.17%), and Guatemalan (16.6%, a difference of 0.19%).
| Demographics | Rating | Rank | Single Father Poverty |
| Immigrants | Senegal | 13.7 /100 | #206 | Poor 16.6% |
| New Zealanders | 13.7 /100 | #207 | Poor 16.6% |
| Eastern Europeans | 13.7 /100 | #208 | Poor 16.6% |
| Europeans | 13.2 /100 | #209 | Poor 16.6% |
| Guatemalans | 12.9 /100 | #210 | Poor 16.6% |
| Arabs | 12.8 /100 | #211 | Poor 16.6% |
| Immigrants | Southern Europe | 11.2 /100 | #212 | Poor 16.7% |
| Ghanaians | 11.0 /100 | #213 | Poor 16.7% |
| Spanish | 10.7 /100 | #214 | Poor 16.7% |
| Immigrants | Scotland | 9.6 /100 | #215 | Tragic 16.7% |
| Immigrants | England | 9.5 /100 | #216 | Tragic 16.7% |
| Cheyenne | 9.3 /100 | #217 | Tragic 16.7% |
| Immigrants | Uganda | 8.6 /100 | #218 | Tragic 16.7% |
| Immigrants | Ghana | 8.1 /100 | #219 | Tragic 16.7% |
| Immigrants | Denmark | 8.1 /100 | #220 | Tragic 16.7% |