Immigrants from Uruguay vs Spaniard Single Female Poverty
COMPARE
Immigrants from Uruguay
Spaniard
Single Female Poverty
Single Female Poverty Comparison
Immigrants from Uruguay
Spaniards
20.6%
SINGLE FEMALE POVERTY
77.7/ 100
METRIC RATING
152nd/ 347
METRIC RANK
22.0%
SINGLE FEMALE POVERTY
4.7/ 100
METRIC RATING
233rd/ 347
METRIC RANK
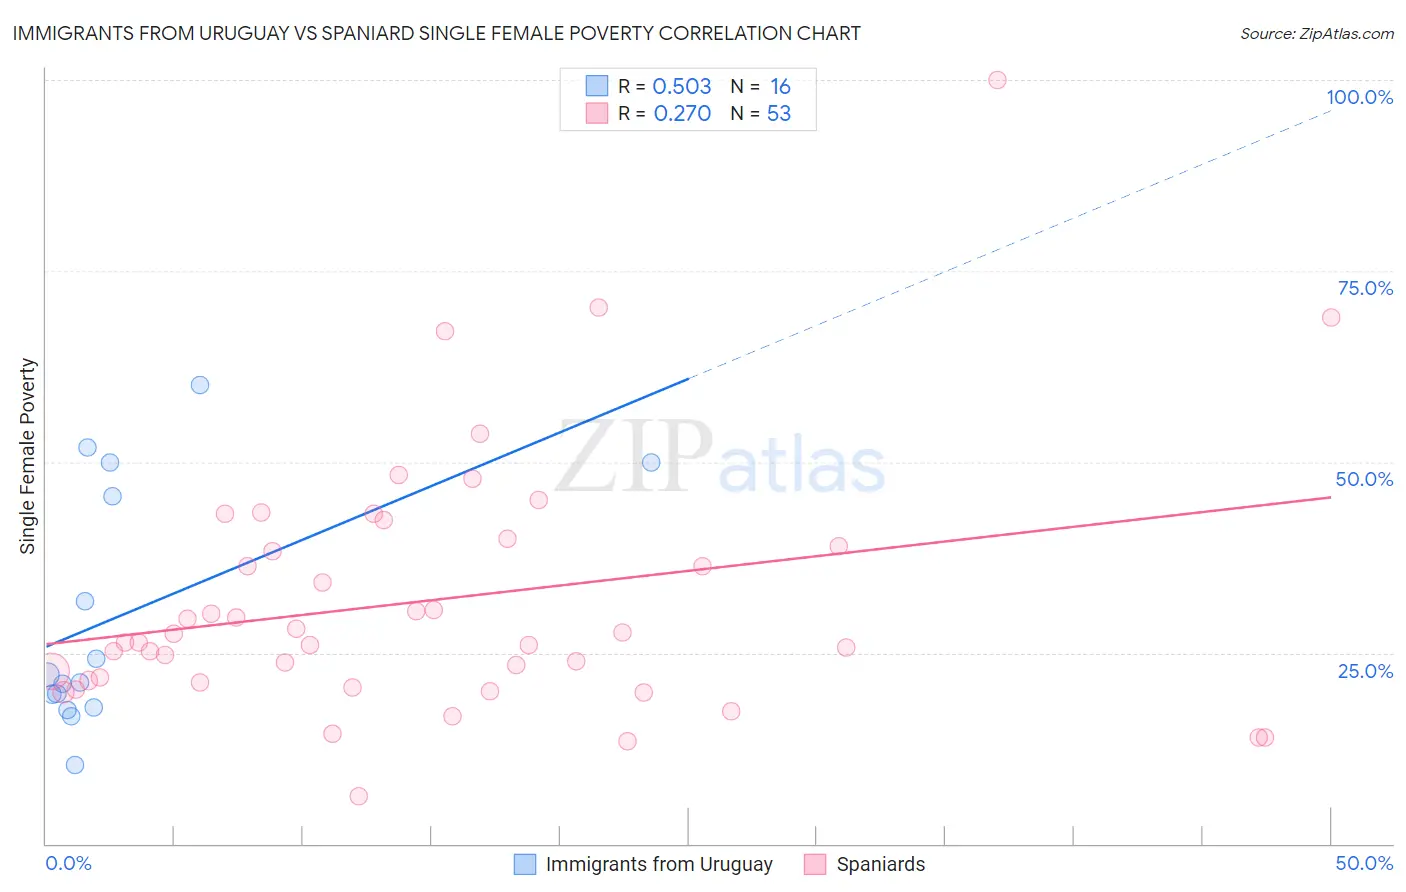
Immigrants from Uruguay vs Spaniard Single Female Poverty Correlation Chart
The statistical analysis conducted on geographies consisting of 132,556,340 people shows a substantial positive correlation between the proportion of Immigrants from Uruguay and poverty level among single females in the United States with a correlation coefficient (R) of 0.503 and weighted average of 20.6%. Similarly, the statistical analysis conducted on geographies consisting of 435,429,561 people shows a weak positive correlation between the proportion of Spaniards and poverty level among single females in the United States with a correlation coefficient (R) of 0.270 and weighted average of 22.0%, a difference of 6.8%.
Single Female Poverty Correlation Summary
| Measurement | Immigrants from Uruguay | Spaniard |
| Minimum | 10.4% | 6.3% |
| Maximum | 60.0% | 100.0% |
| Range | 49.6% | 93.7% |
| Mean | 29.9% | 31.9% |
| Median | 21.6% | 26.3% |
| Interquartile 25% (IQ1) | 18.7% | 21.2% |
| Interquartile 75% (IQ3) | 47.7% | 39.4% |
| Interquartile Range (IQR) | 29.0% | 18.2% |
| Standard Deviation (Sample) | 15.8% | 16.8% |
| Standard Deviation (Population) | 15.3% | 16.6% |
Similar Demographics by Single Female Poverty
Demographics Similar to Immigrants from Uruguay by Single Female Poverty
In terms of single female poverty, the demographic groups most similar to Immigrants from Uruguay are Swedish (20.6%, a difference of 0.050%), Immigrants from Western Europe (20.6%, a difference of 0.080%), Samoan (20.6%, a difference of 0.15%), South American Indian (20.6%, a difference of 0.18%), and Puget Sound Salish (20.6%, a difference of 0.19%).
| Demographics | Rating | Rank | Single Female Poverty |
| Austrians | 85.8 /100 | #145 | Excellent 20.4% |
| Venezuelans | 85.5 /100 | #146 | Excellent 20.4% |
| South Africans | 85.3 /100 | #147 | Excellent 20.4% |
| Luxembourgers | 84.9 /100 | #148 | Excellent 20.4% |
| Portuguese | 81.5 /100 | #149 | Excellent 20.5% |
| Immigrants | Denmark | 80.5 /100 | #150 | Excellent 20.5% |
| Puget Sound Salish | 79.6 /100 | #151 | Good 20.6% |
| Immigrants | Uruguay | 77.7 /100 | #152 | Good 20.6% |
| Swedes | 77.1 /100 | #153 | Good 20.6% |
| Immigrants | Western Europe | 76.7 /100 | #154 | Good 20.6% |
| Samoans | 76.0 /100 | #155 | Good 20.6% |
| South American Indians | 75.7 /100 | #156 | Good 20.6% |
| Immigrants | Oceania | 74.3 /100 | #157 | Good 20.7% |
| Danes | 73.0 /100 | #158 | Good 20.7% |
| Costa Ricans | 71.8 /100 | #159 | Good 20.7% |
Demographics Similar to Spaniards by Single Female Poverty
In terms of single female poverty, the demographic groups most similar to Spaniards are Spanish (22.0%, a difference of 0.0%), Dutch (22.0%, a difference of 0.020%), Immigrants from Thailand (22.0%, a difference of 0.090%), Welsh (22.0%, a difference of 0.11%), and Immigrants from Ecuador (22.0%, a difference of 0.18%).
| Demographics | Rating | Rank | Single Female Poverty |
| Immigrants | Portugal | 5.8 /100 | #226 | Tragic 21.9% |
| Immigrants | Ghana | 5.8 /100 | #227 | Tragic 21.9% |
| Salvadorans | 5.5 /100 | #228 | Tragic 21.9% |
| Tlingit-Haida | 5.4 /100 | #229 | Tragic 21.9% |
| Immigrants | Western Africa | 5.3 /100 | #230 | Tragic 22.0% |
| Welsh | 5.0 /100 | #231 | Tragic 22.0% |
| Immigrants | Thailand | 5.0 /100 | #232 | Tragic 22.0% |
| Spaniards | 4.7 /100 | #233 | Tragic 22.0% |
| Spanish | 4.7 /100 | #234 | Tragic 22.0% |
| Dutch | 4.6 /100 | #235 | Tragic 22.0% |
| Immigrants | Ecuador | 4.2 /100 | #236 | Tragic 22.0% |
| Vietnamese | 4.0 /100 | #237 | Tragic 22.0% |
| French Canadians | 2.8 /100 | #238 | Tragic 22.2% |
| Malaysians | 2.8 /100 | #239 | Tragic 22.2% |
| French | 2.3 /100 | #240 | Tragic 22.2% |