Immigrants from Albania vs Spaniard Single Female Poverty
COMPARE
Immigrants from Albania
Spaniard
Single Female Poverty
Single Female Poverty Comparison
Immigrants from Albania
Spaniards
19.4%
SINGLE FEMALE POVERTY
99.2/ 100
METRIC RATING
85th/ 347
METRIC RANK
22.0%
SINGLE FEMALE POVERTY
4.7/ 100
METRIC RATING
233rd/ 347
METRIC RANK
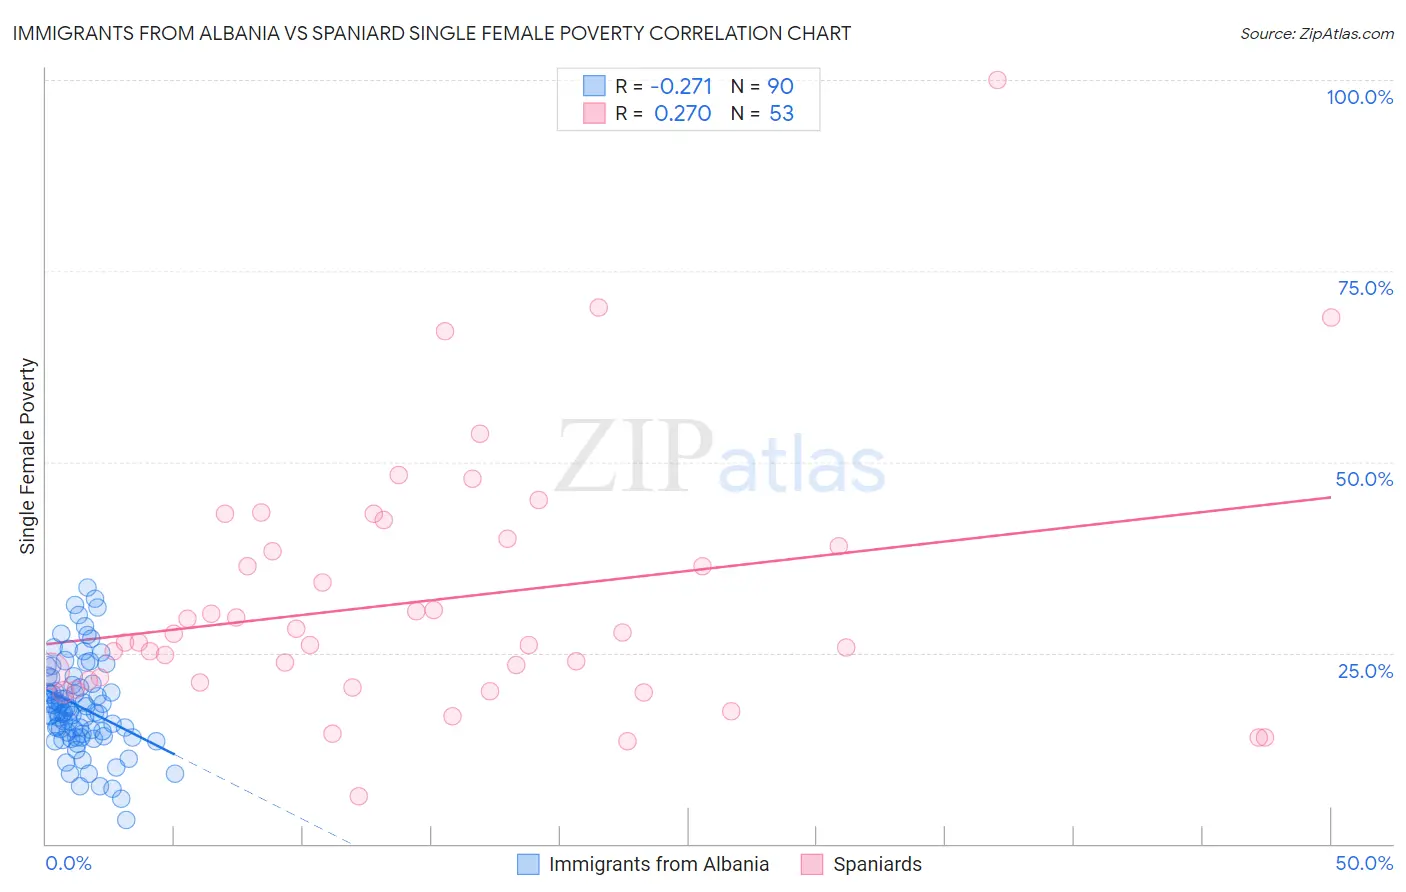
Immigrants from Albania vs Spaniard Single Female Poverty Correlation Chart
The statistical analysis conducted on geographies consisting of 118,461,205 people shows a weak negative correlation between the proportion of Immigrants from Albania and poverty level among single females in the United States with a correlation coefficient (R) of -0.271 and weighted average of 19.4%. Similarly, the statistical analysis conducted on geographies consisting of 435,429,561 people shows a weak positive correlation between the proportion of Spaniards and poverty level among single females in the United States with a correlation coefficient (R) of 0.270 and weighted average of 22.0%, a difference of 13.1%.
Single Female Poverty Correlation Summary
| Measurement | Immigrants from Albania | Spaniard |
| Minimum | 3.1% | 6.3% |
| Maximum | 33.6% | 100.0% |
| Range | 30.4% | 93.7% |
| Mean | 17.9% | 31.9% |
| Median | 17.2% | 26.3% |
| Interquartile 25% (IQ1) | 14.0% | 21.2% |
| Interquartile 75% (IQ3) | 20.9% | 39.4% |
| Interquartile Range (IQR) | 6.9% | 18.2% |
| Standard Deviation (Sample) | 6.1% | 16.8% |
| Standard Deviation (Population) | 6.0% | 16.6% |
Similar Demographics by Single Female Poverty
Demographics Similar to Immigrants from Albania by Single Female Poverty
In terms of single female poverty, the demographic groups most similar to Immigrants from Albania are Greek (19.4%, a difference of 0.0%), Immigrants from Sweden (19.4%, a difference of 0.040%), Taiwanese (19.4%, a difference of 0.12%), Immigrants from Malaysia (19.4%, a difference of 0.13%), and Immigrants from Scotland (19.4%, a difference of 0.14%).
| Demographics | Rating | Rank | Single Female Poverty |
| Albanians | 99.3 /100 | #78 | Exceptional 19.4% |
| Immigrants | Sierra Leone | 99.3 /100 | #79 | Exceptional 19.4% |
| Immigrants | Australia | 99.3 /100 | #80 | Exceptional 19.4% |
| Immigrants | Scotland | 99.2 /100 | #81 | Exceptional 19.4% |
| Immigrants | Malaysia | 99.2 /100 | #82 | Exceptional 19.4% |
| Taiwanese | 99.2 /100 | #83 | Exceptional 19.4% |
| Immigrants | Sweden | 99.2 /100 | #84 | Exceptional 19.4% |
| Immigrants | Albania | 99.2 /100 | #85 | Exceptional 19.4% |
| Greeks | 99.2 /100 | #86 | Exceptional 19.4% |
| Zimbabweans | 99.0 /100 | #87 | Exceptional 19.5% |
| Afghans | 99.0 /100 | #88 | Exceptional 19.5% |
| Immigrants | Ukraine | 99.0 /100 | #89 | Exceptional 19.5% |
| Immigrants | Lebanon | 98.8 /100 | #90 | Exceptional 19.6% |
| Soviet Union | 98.8 /100 | #91 | Exceptional 19.6% |
| Italians | 98.8 /100 | #92 | Exceptional 19.6% |
Demographics Similar to Spaniards by Single Female Poverty
In terms of single female poverty, the demographic groups most similar to Spaniards are Spanish (22.0%, a difference of 0.0%), Dutch (22.0%, a difference of 0.020%), Immigrants from Thailand (22.0%, a difference of 0.090%), Welsh (22.0%, a difference of 0.11%), and Immigrants from Ecuador (22.0%, a difference of 0.18%).
| Demographics | Rating | Rank | Single Female Poverty |
| Immigrants | Portugal | 5.8 /100 | #226 | Tragic 21.9% |
| Immigrants | Ghana | 5.8 /100 | #227 | Tragic 21.9% |
| Salvadorans | 5.5 /100 | #228 | Tragic 21.9% |
| Tlingit-Haida | 5.4 /100 | #229 | Tragic 21.9% |
| Immigrants | Western Africa | 5.3 /100 | #230 | Tragic 22.0% |
| Welsh | 5.0 /100 | #231 | Tragic 22.0% |
| Immigrants | Thailand | 5.0 /100 | #232 | Tragic 22.0% |
| Spaniards | 4.7 /100 | #233 | Tragic 22.0% |
| Spanish | 4.7 /100 | #234 | Tragic 22.0% |
| Dutch | 4.6 /100 | #235 | Tragic 22.0% |
| Immigrants | Ecuador | 4.2 /100 | #236 | Tragic 22.0% |
| Vietnamese | 4.0 /100 | #237 | Tragic 22.0% |
| French Canadians | 2.8 /100 | #238 | Tragic 22.2% |
| Malaysians | 2.8 /100 | #239 | Tragic 22.2% |
| French | 2.3 /100 | #240 | Tragic 22.2% |