Senegalese vs Spaniard Single Female Poverty
COMPARE
Senegalese
Spaniard
Single Female Poverty
Single Female Poverty Comparison
Senegalese
Spaniards
23.0%
SINGLE FEMALE POVERTY
0.2/ 100
METRIC RATING
267th/ 347
METRIC RANK
22.0%
SINGLE FEMALE POVERTY
4.7/ 100
METRIC RATING
233rd/ 347
METRIC RANK
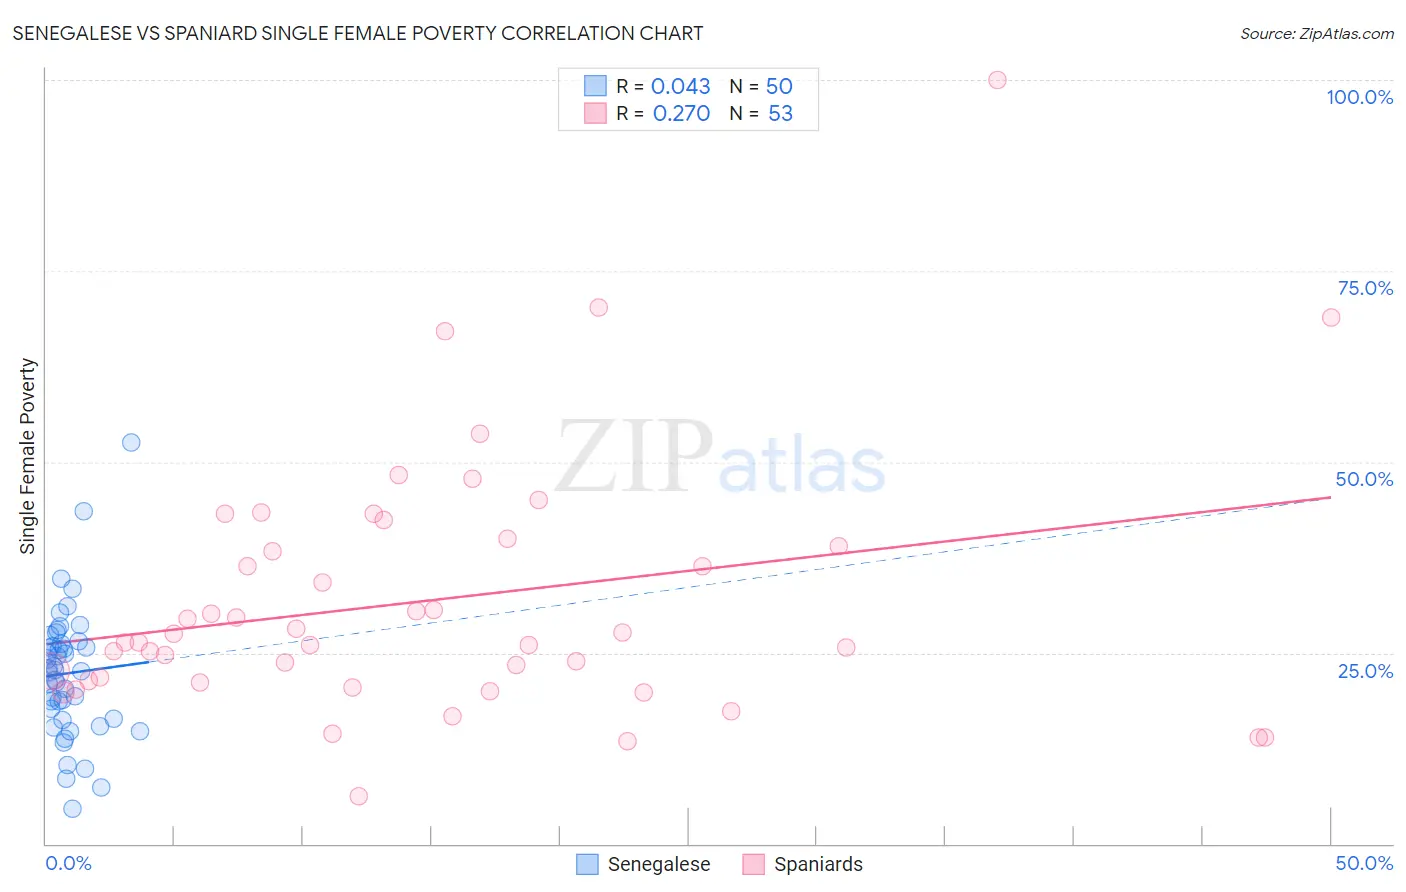
Senegalese vs Spaniard Single Female Poverty Correlation Chart
The statistical analysis conducted on geographies consisting of 77,927,948 people shows no correlation between the proportion of Senegalese and poverty level among single females in the United States with a correlation coefficient (R) of 0.043 and weighted average of 23.0%. Similarly, the statistical analysis conducted on geographies consisting of 435,429,561 people shows a weak positive correlation between the proportion of Spaniards and poverty level among single females in the United States with a correlation coefficient (R) of 0.270 and weighted average of 22.0%, a difference of 4.8%.
Single Female Poverty Correlation Summary
| Measurement | Senegalese | Spaniard |
| Minimum | 4.5% | 6.3% |
| Maximum | 52.6% | 100.0% |
| Range | 48.1% | 93.7% |
| Mean | 22.3% | 31.9% |
| Median | 22.7% | 26.3% |
| Interquartile 25% (IQ1) | 16.3% | 21.2% |
| Interquartile 75% (IQ3) | 26.2% | 39.4% |
| Interquartile Range (IQR) | 9.9% | 18.2% |
| Standard Deviation (Sample) | 8.6% | 16.8% |
| Standard Deviation (Population) | 8.5% | 16.6% |
Similar Demographics by Single Female Poverty
Demographics Similar to Senegalese by Single Female Poverty
In terms of single female poverty, the demographic groups most similar to Senegalese are Immigrants from Micronesia (23.0%, a difference of 0.060%), Fijian (23.1%, a difference of 0.070%), Hmong (23.1%, a difference of 0.10%), Central American (23.0%, a difference of 0.27%), and Inupiat (23.1%, a difference of 0.35%).
| Demographics | Rating | Rank | Single Female Poverty |
| Celtics | 0.5 /100 | #260 | Tragic 22.7% |
| Immigrants | Cabo Verde | 0.4 /100 | #261 | Tragic 22.8% |
| British West Indians | 0.4 /100 | #262 | Tragic 22.8% |
| Scotch-Irish | 0.3 /100 | #263 | Tragic 22.9% |
| Immigrants | Laos | 0.3 /100 | #264 | Tragic 22.9% |
| Central Americans | 0.2 /100 | #265 | Tragic 23.0% |
| Immigrants | Micronesia | 0.2 /100 | #266 | Tragic 23.0% |
| Senegalese | 0.2 /100 | #267 | Tragic 23.0% |
| Fijians | 0.2 /100 | #268 | Tragic 23.1% |
| Hmong | 0.2 /100 | #269 | Tragic 23.1% |
| Inupiat | 0.2 /100 | #270 | Tragic 23.1% |
| Sub-Saharan Africans | 0.1 /100 | #271 | Tragic 23.2% |
| Immigrants | Senegal | 0.1 /100 | #272 | Tragic 23.2% |
| Alaska Natives | 0.1 /100 | #273 | Tragic 23.3% |
| Marshallese | 0.1 /100 | #274 | Tragic 23.3% |
Demographics Similar to Spaniards by Single Female Poverty
In terms of single female poverty, the demographic groups most similar to Spaniards are Spanish (22.0%, a difference of 0.0%), Dutch (22.0%, a difference of 0.020%), Immigrants from Thailand (22.0%, a difference of 0.090%), Welsh (22.0%, a difference of 0.11%), and Immigrants from Ecuador (22.0%, a difference of 0.18%).
| Demographics | Rating | Rank | Single Female Poverty |
| Immigrants | Portugal | 5.8 /100 | #226 | Tragic 21.9% |
| Immigrants | Ghana | 5.8 /100 | #227 | Tragic 21.9% |
| Salvadorans | 5.5 /100 | #228 | Tragic 21.9% |
| Tlingit-Haida | 5.4 /100 | #229 | Tragic 21.9% |
| Immigrants | Western Africa | 5.3 /100 | #230 | Tragic 22.0% |
| Welsh | 5.0 /100 | #231 | Tragic 22.0% |
| Immigrants | Thailand | 5.0 /100 | #232 | Tragic 22.0% |
| Spaniards | 4.7 /100 | #233 | Tragic 22.0% |
| Spanish | 4.7 /100 | #234 | Tragic 22.0% |
| Dutch | 4.6 /100 | #235 | Tragic 22.0% |
| Immigrants | Ecuador | 4.2 /100 | #236 | Tragic 22.0% |
| Vietnamese | 4.0 /100 | #237 | Tragic 22.0% |
| French Canadians | 2.8 /100 | #238 | Tragic 22.2% |
| Malaysians | 2.8 /100 | #239 | Tragic 22.2% |
| French | 2.3 /100 | #240 | Tragic 22.2% |