Immigrants from Uruguay vs Immigrants from India Female Poverty
COMPARE
Immigrants from Uruguay
Immigrants from India
Female Poverty
Female Poverty Comparison
Immigrants from Uruguay
Immigrants from India
14.0%
FEMALE POVERTY
14.0/ 100
METRIC RATING
206th/ 347
METRIC RANK
9.9%
FEMALE POVERTY
100.0/ 100
METRIC RATING
1st/ 347
METRIC RANK
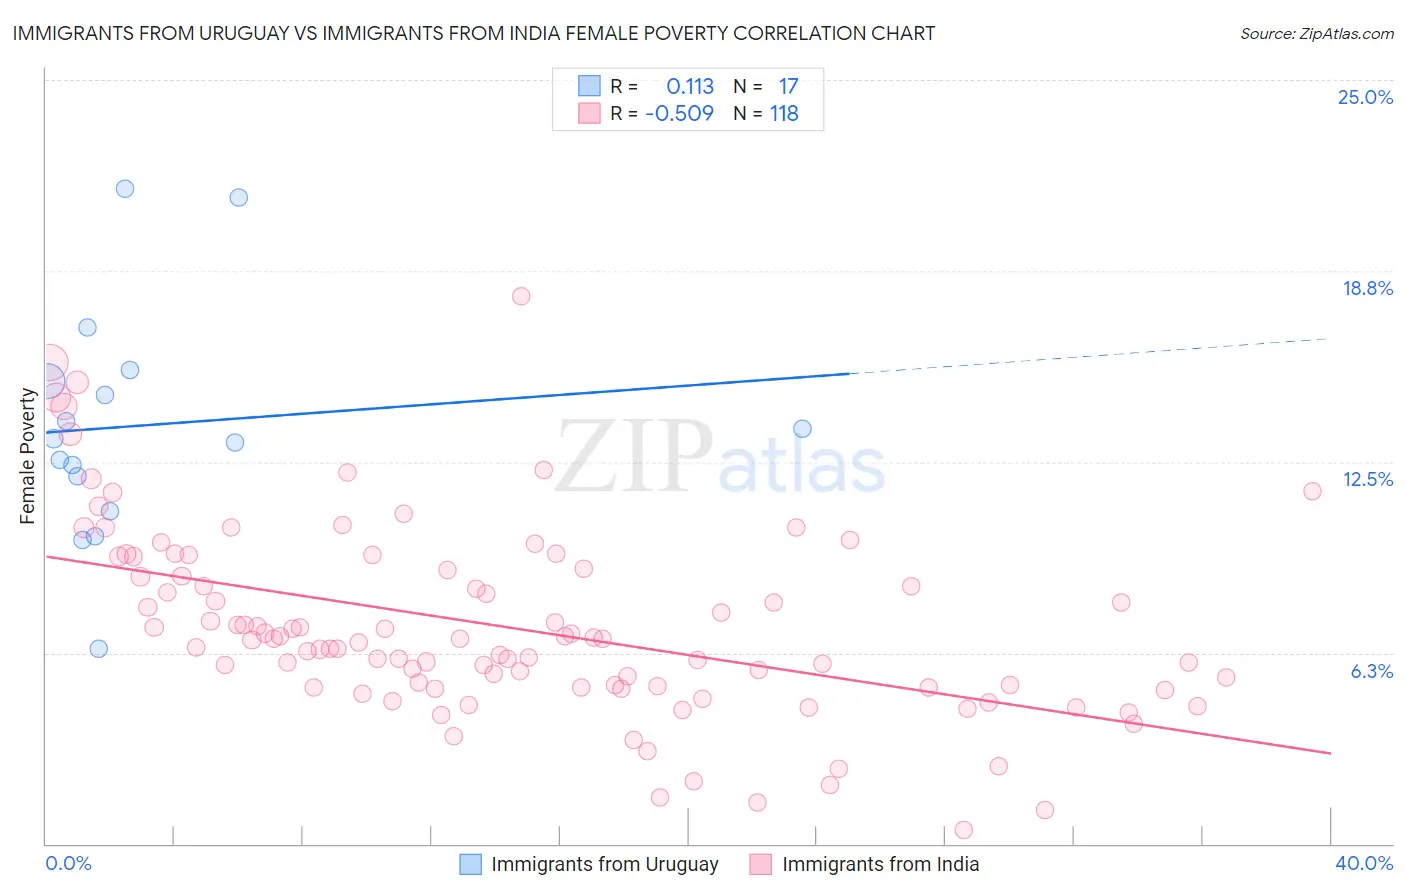
Immigrants from Uruguay vs Immigrants from India Female Poverty Correlation Chart
The statistical analysis conducted on geographies consisting of 133,241,940 people shows a poor positive correlation between the proportion of Immigrants from Uruguay and poverty level among females in the United States with a correlation coefficient (R) of 0.113 and weighted average of 14.0%. Similarly, the statistical analysis conducted on geographies consisting of 433,627,117 people shows a substantial negative correlation between the proportion of Immigrants from India and poverty level among females in the United States with a correlation coefficient (R) of -0.509 and weighted average of 9.9%, a difference of 42.0%.
Female Poverty Correlation Summary
| Measurement | Immigrants from Uruguay | Immigrants from India |
| Minimum | 6.4% | 0.46% |
| Maximum | 21.5% | 17.9% |
| Range | 15.1% | 17.5% |
| Mean | 13.7% | 7.1% |
| Median | 13.3% | 6.7% |
| Interquartile 25% (IQ1) | 11.4% | 5.1% |
| Interquartile 75% (IQ3) | 15.3% | 9.0% |
| Interquartile Range (IQR) | 3.9% | 3.8% |
| Standard Deviation (Sample) | 3.8% | 3.1% |
| Standard Deviation (Population) | 3.7% | 3.1% |
Similar Demographics by Female Poverty
Demographics Similar to Immigrants from Uruguay by Female Poverty
In terms of female poverty, the demographic groups most similar to Immigrants from Uruguay are Ugandan (14.0%, a difference of 0.27%), Spaniard (13.9%, a difference of 0.84%), Immigrants from Western Asia (13.9%, a difference of 1.1%), Immigrants from Eastern Africa (14.2%, a difference of 1.1%), and Hmong (13.9%, a difference of 1.2%).
| Demographics | Rating | Rank | Female Poverty |
| Immigrants | Lebanon | 25.6 /100 | #199 | Fair 13.8% |
| Spanish | 21.4 /100 | #200 | Fair 13.9% |
| Immigrants | Kenya | 21.1 /100 | #201 | Fair 13.9% |
| Hmong | 21.1 /100 | #202 | Fair 13.9% |
| Immigrants | Western Asia | 20.7 /100 | #203 | Fair 13.9% |
| Spaniards | 18.9 /100 | #204 | Poor 13.9% |
| Ugandans | 15.4 /100 | #205 | Poor 14.0% |
| Immigrants | Uruguay | 14.0 /100 | #206 | Poor 14.0% |
| Immigrants | Eastern Africa | 9.0 /100 | #207 | Tragic 14.2% |
| Immigrants | Azores | 7.9 /100 | #208 | Tragic 14.2% |
| Panamanians | 7.7 /100 | #209 | Tragic 14.2% |
| Malaysians | 7.4 /100 | #210 | Tragic 14.3% |
| Moroccans | 7.2 /100 | #211 | Tragic 14.3% |
| Bermudans | 5.5 /100 | #212 | Tragic 14.4% |
| Alaskan Athabascans | 5.3 /100 | #213 | Tragic 14.4% |
Demographics Similar to Immigrants from India by Female Poverty
In terms of female poverty, the demographic groups most similar to Immigrants from India are Chinese (10.4%, a difference of 5.2%), Thai (10.5%, a difference of 5.9%), Immigrants from Taiwan (10.5%, a difference of 6.7%), Filipino (10.9%, a difference of 10.8%), and Immigrants from Ireland (11.0%, a difference of 11.3%).
| Demographics | Rating | Rank | Female Poverty |
| Immigrants | India | 100.0 /100 | #1 | Exceptional 9.9% |
| Chinese | 100.0 /100 | #2 | Exceptional 10.4% |
| Thais | 100.0 /100 | #3 | Exceptional 10.5% |
| Immigrants | Taiwan | 100.0 /100 | #4 | Exceptional 10.5% |
| Filipinos | 100.0 /100 | #5 | Exceptional 10.9% |
| Immigrants | Ireland | 99.9 /100 | #6 | Exceptional 11.0% |
| Assyrians/Chaldeans/Syriacs | 99.9 /100 | #7 | Exceptional 11.0% |
| Immigrants | South Central Asia | 99.9 /100 | #8 | Exceptional 11.1% |
| Bulgarians | 99.9 /100 | #9 | Exceptional 11.1% |
| Immigrants | Hong Kong | 99.9 /100 | #10 | Exceptional 11.2% |
| Maltese | 99.9 /100 | #11 | Exceptional 11.2% |
| Bhutanese | 99.9 /100 | #12 | Exceptional 11.3% |
| Immigrants | Lithuania | 99.9 /100 | #13 | Exceptional 11.3% |
| Lithuanians | 99.8 /100 | #14 | Exceptional 11.4% |
| Latvians | 99.8 /100 | #15 | Exceptional 11.4% |