Immigrants from Uruguay vs Tongan Family Poverty
COMPARE
Immigrants from Uruguay
Tongan
Family Poverty
Family Poverty Comparison
Immigrants from Uruguay
Tongans
9.5%
FAMILY POVERTY
14.0/ 100
METRIC RATING
209th/ 347
METRIC RANK
7.7%
FAMILY POVERTY
98.9/ 100
METRIC RATING
46th/ 347
METRIC RANK
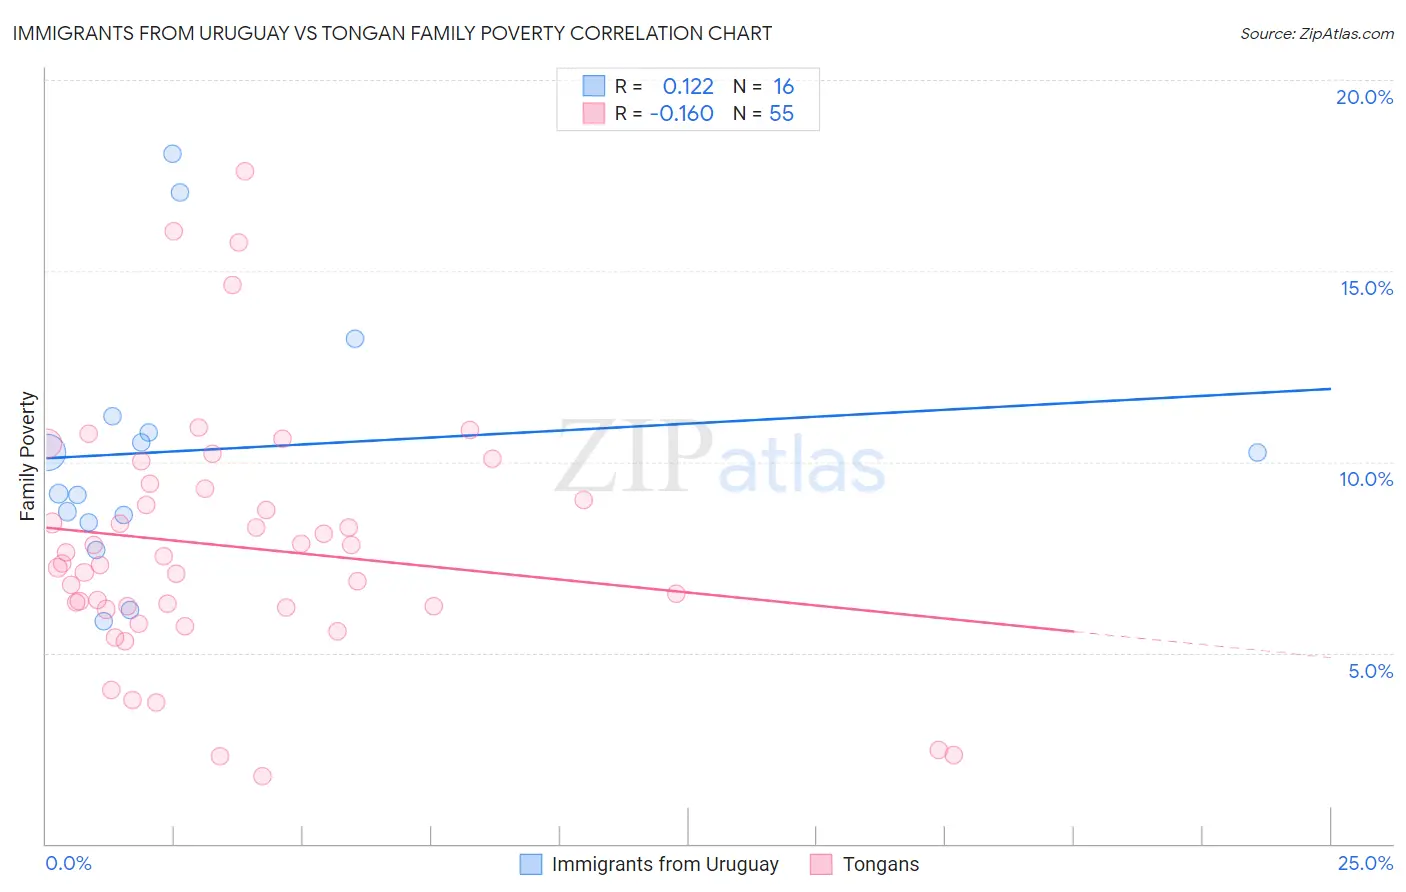
Immigrants from Uruguay vs Tongan Family Poverty Correlation Chart
The statistical analysis conducted on geographies consisting of 133,161,280 people shows a poor positive correlation between the proportion of Immigrants from Uruguay and poverty level among families in the United States with a correlation coefficient (R) of 0.122 and weighted average of 9.5%. Similarly, the statistical analysis conducted on geographies consisting of 102,821,565 people shows a poor negative correlation between the proportion of Tongans and poverty level among families in the United States with a correlation coefficient (R) of -0.160 and weighted average of 7.7%, a difference of 24.4%.
Family Poverty Correlation Summary
| Measurement | Immigrants from Uruguay | Tongan |
| Minimum | 5.8% | 1.8% |
| Maximum | 18.1% | 17.6% |
| Range | 12.2% | 15.9% |
| Mean | 10.3% | 7.8% |
| Median | 9.7% | 7.3% |
| Interquartile 25% (IQ1) | 8.5% | 6.2% |
| Interquartile 75% (IQ3) | 11.0% | 9.3% |
| Interquartile Range (IQR) | 2.5% | 3.1% |
| Standard Deviation (Sample) | 3.4% | 3.2% |
| Standard Deviation (Population) | 3.3% | 3.2% |
Similar Demographics by Family Poverty
Demographics Similar to Immigrants from Uruguay by Family Poverty
In terms of family poverty, the demographic groups most similar to Immigrants from Uruguay are Immigrants from Eastern Africa (9.5%, a difference of 0.29%), Sierra Leonean (9.5%, a difference of 0.40%), Alsatian (9.6%, a difference of 0.73%), Immigrants from South America (9.5%, a difference of 0.93%), and Aleut (9.5%, a difference of 0.94%).
| Demographics | Rating | Rank | Family Poverty |
| Immigrants | Sierra Leone | 19.6 /100 | #202 | Poor 9.4% |
| German Russians | 19.4 /100 | #203 | Poor 9.4% |
| Immigrants | Lebanon | 18.9 /100 | #204 | Poor 9.4% |
| Aleuts | 18.0 /100 | #205 | Poor 9.5% |
| Immigrants | South America | 18.0 /100 | #206 | Poor 9.5% |
| Sierra Leoneans | 15.6 /100 | #207 | Poor 9.5% |
| Immigrants | Eastern Africa | 15.1 /100 | #208 | Poor 9.5% |
| Immigrants | Uruguay | 14.0 /100 | #209 | Poor 9.5% |
| Alsatians | 11.3 /100 | #210 | Poor 9.6% |
| Malaysians | 10.6 /100 | #211 | Poor 9.6% |
| Immigrants | Thailand | 9.7 /100 | #212 | Tragic 9.7% |
| Osage | 8.0 /100 | #213 | Tragic 9.7% |
| Immigrants | Micronesia | 6.7 /100 | #214 | Tragic 9.8% |
| Immigrants | Nonimmigrants | 6.7 /100 | #215 | Tragic 9.8% |
| Moroccans | 6.5 /100 | #216 | Tragic 9.8% |
Demographics Similar to Tongans by Family Poverty
In terms of family poverty, the demographic groups most similar to Tongans are Okinawan (7.7%, a difference of 0.010%), Immigrants from Czechoslovakia (7.7%, a difference of 0.010%), Immigrants from Sri Lanka (7.7%, a difference of 0.030%), German (7.7%, a difference of 0.14%), and Immigrants from Bolivia (7.7%, a difference of 0.22%).
| Demographics | Rating | Rank | Family Poverty |
| Carpatho Rusyns | 99.3 /100 | #39 | Exceptional 7.5% |
| Slovenes | 99.3 /100 | #40 | Exceptional 7.5% |
| Immigrants | Australia | 99.2 /100 | #41 | Exceptional 7.6% |
| Scandinavians | 99.1 /100 | #42 | Exceptional 7.6% |
| Immigrants | Austria | 99.1 /100 | #43 | Exceptional 7.6% |
| Germans | 99.0 /100 | #44 | Exceptional 7.7% |
| Okinawans | 98.9 /100 | #45 | Exceptional 7.7% |
| Tongans | 98.9 /100 | #46 | Exceptional 7.7% |
| Immigrants | Czechoslovakia | 98.9 /100 | #47 | Exceptional 7.7% |
| Immigrants | Sri Lanka | 98.9 /100 | #48 | Exceptional 7.7% |
| Immigrants | Bolivia | 98.9 /100 | #49 | Exceptional 7.7% |
| Immigrants | North Macedonia | 98.9 /100 | #50 | Exceptional 7.7% |
| Immigrants | Moldova | 98.8 /100 | #51 | Exceptional 7.7% |
| Indians (Asian) | 98.8 /100 | #52 | Exceptional 7.7% |
| Swiss | 98.8 /100 | #53 | Exceptional 7.7% |