Immigrants from Uruguay vs Immigrants from Egypt Family Poverty
COMPARE
Immigrants from Uruguay
Immigrants from Egypt
Family Poverty
Family Poverty Comparison
Immigrants from Uruguay
Immigrants from Egypt
9.5%
FAMILY POVERTY
14.0/ 100
METRIC RATING
209th/ 347
METRIC RANK
8.3%
FAMILY POVERTY
91.6/ 100
METRIC RATING
120th/ 347
METRIC RANK
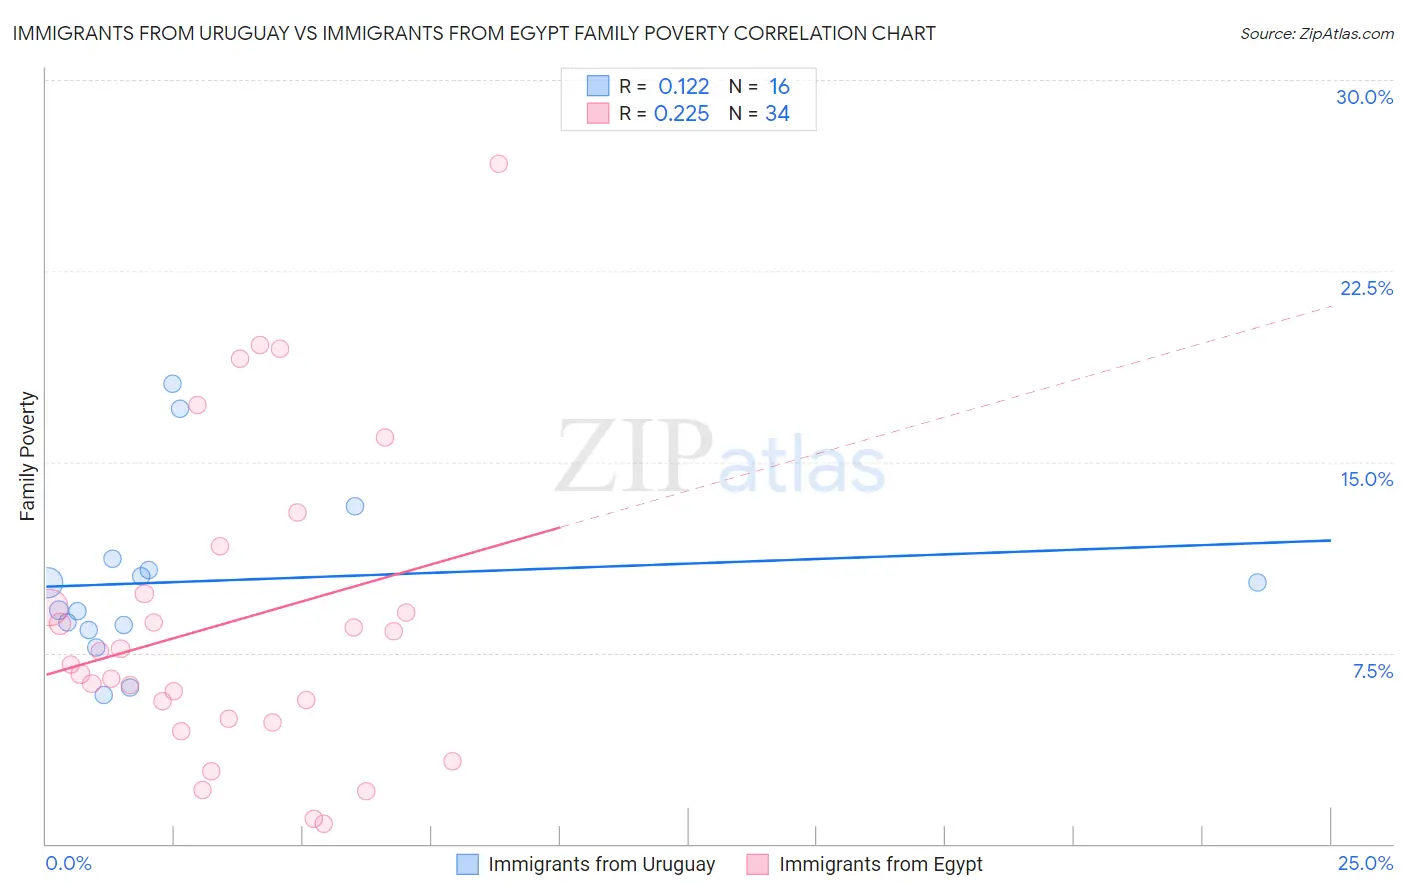
Immigrants from Uruguay vs Immigrants from Egypt Family Poverty Correlation Chart
The statistical analysis conducted on geographies consisting of 133,161,280 people shows a poor positive correlation between the proportion of Immigrants from Uruguay and poverty level among families in the United States with a correlation coefficient (R) of 0.122 and weighted average of 9.5%. Similarly, the statistical analysis conducted on geographies consisting of 245,176,811 people shows a weak positive correlation between the proportion of Immigrants from Egypt and poverty level among families in the United States with a correlation coefficient (R) of 0.225 and weighted average of 8.3%, a difference of 15.0%.
Family Poverty Correlation Summary
| Measurement | Immigrants from Uruguay | Immigrants from Egypt |
| Minimum | 5.8% | 0.80% |
| Maximum | 18.1% | 26.7% |
| Range | 12.2% | 25.9% |
| Mean | 10.3% | 8.7% |
| Median | 9.7% | 7.3% |
| Interquartile 25% (IQ1) | 8.5% | 4.9% |
| Interquartile 75% (IQ3) | 11.0% | 9.8% |
| Interquartile Range (IQR) | 2.5% | 4.9% |
| Standard Deviation (Sample) | 3.4% | 6.0% |
| Standard Deviation (Population) | 3.3% | 5.9% |
Similar Demographics by Family Poverty
Demographics Similar to Immigrants from Uruguay by Family Poverty
In terms of family poverty, the demographic groups most similar to Immigrants from Uruguay are Immigrants from Eastern Africa (9.5%, a difference of 0.29%), Sierra Leonean (9.5%, a difference of 0.40%), Alsatian (9.6%, a difference of 0.73%), Immigrants from South America (9.5%, a difference of 0.93%), and Aleut (9.5%, a difference of 0.94%).
| Demographics | Rating | Rank | Family Poverty |
| Immigrants | Sierra Leone | 19.6 /100 | #202 | Poor 9.4% |
| German Russians | 19.4 /100 | #203 | Poor 9.4% |
| Immigrants | Lebanon | 18.9 /100 | #204 | Poor 9.4% |
| Aleuts | 18.0 /100 | #205 | Poor 9.5% |
| Immigrants | South America | 18.0 /100 | #206 | Poor 9.5% |
| Sierra Leoneans | 15.6 /100 | #207 | Poor 9.5% |
| Immigrants | Eastern Africa | 15.1 /100 | #208 | Poor 9.5% |
| Immigrants | Uruguay | 14.0 /100 | #209 | Poor 9.5% |
| Alsatians | 11.3 /100 | #210 | Poor 9.6% |
| Malaysians | 10.6 /100 | #211 | Poor 9.6% |
| Immigrants | Thailand | 9.7 /100 | #212 | Tragic 9.7% |
| Osage | 8.0 /100 | #213 | Tragic 9.7% |
| Immigrants | Micronesia | 6.7 /100 | #214 | Tragic 9.8% |
| Immigrants | Nonimmigrants | 6.7 /100 | #215 | Tragic 9.8% |
| Moroccans | 6.5 /100 | #216 | Tragic 9.8% |
Demographics Similar to Immigrants from Egypt by Family Poverty
In terms of family poverty, the demographic groups most similar to Immigrants from Egypt are Native Hawaiian (8.3%, a difference of 0.17%), Paraguayan (8.3%, a difference of 0.18%), Palestinian (8.3%, a difference of 0.25%), Soviet Union (8.3%, a difference of 0.35%), and Pakistani (8.3%, a difference of 0.39%).
| Demographics | Rating | Rank | Family Poverty |
| Canadians | 94.2 /100 | #113 | Exceptional 8.2% |
| Immigrants | Zimbabwe | 94.0 /100 | #114 | Exceptional 8.2% |
| Immigrants | Israel | 93.5 /100 | #115 | Exceptional 8.2% |
| South Africans | 93.4 /100 | #116 | Exceptional 8.2% |
| Immigrants | Russia | 93.2 /100 | #117 | Exceptional 8.2% |
| Immigrants | Western Europe | 92.9 /100 | #118 | Exceptional 8.2% |
| French | 92.8 /100 | #119 | Exceptional 8.3% |
| Immigrants | Egypt | 91.6 /100 | #120 | Exceptional 8.3% |
| Native Hawaiians | 91.3 /100 | #121 | Exceptional 8.3% |
| Paraguayans | 91.2 /100 | #122 | Exceptional 8.3% |
| Palestinians | 91.1 /100 | #123 | Exceptional 8.3% |
| Soviet Union | 90.8 /100 | #124 | Exceptional 8.3% |
| Pakistanis | 90.8 /100 | #125 | Exceptional 8.3% |
| Icelanders | 90.3 /100 | #126 | Exceptional 8.3% |
| Immigrants | Hungary | 89.9 /100 | #127 | Excellent 8.4% |