French American Indian vs Norwegian Male Poverty
COMPARE
French American Indian
Norwegian
Male Poverty
Male Poverty Comparison
French American Indians
Norwegians
12.7%
MALE POVERTY
0.4/ 100
METRIC RATING
237th/ 347
METRIC RANK
9.5%
MALE POVERTY
99.8/ 100
METRIC RATING
17th/ 347
METRIC RANK
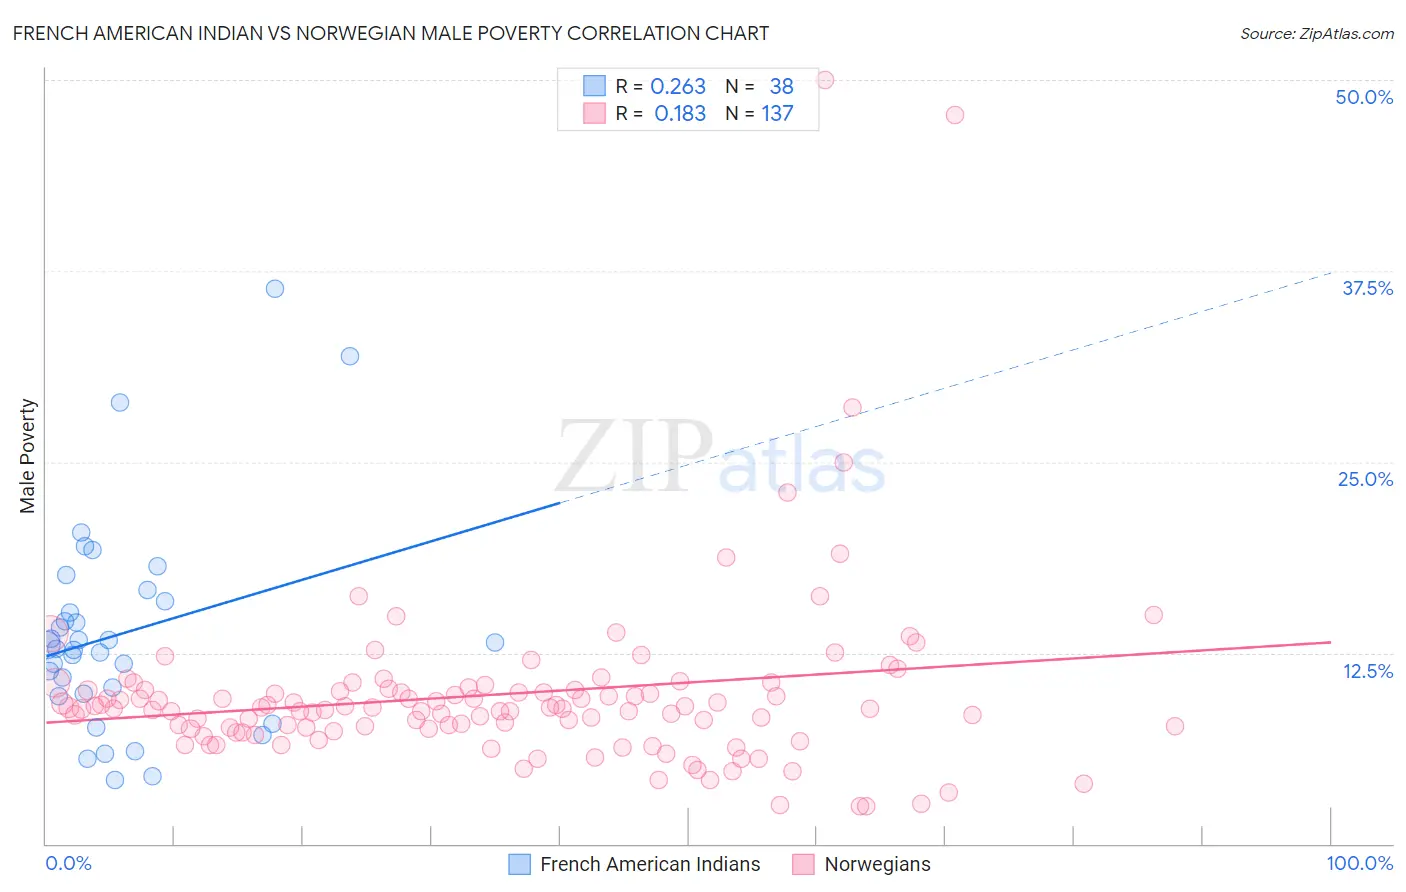
French American Indian vs Norwegian Male Poverty Correlation Chart
The statistical analysis conducted on geographies consisting of 131,954,359 people shows a weak positive correlation between the proportion of French American Indians and poverty level among males in the United States with a correlation coefficient (R) of 0.263 and weighted average of 12.7%. Similarly, the statistical analysis conducted on geographies consisting of 532,206,209 people shows a poor positive correlation between the proportion of Norwegians and poverty level among males in the United States with a correlation coefficient (R) of 0.183 and weighted average of 9.5%, a difference of 33.1%.
Male Poverty Correlation Summary
| Measurement | French American Indian | Norwegian |
| Minimum | 4.1% | 2.4% |
| Maximum | 36.3% | 50.0% |
| Range | 32.2% | 47.6% |
| Mean | 13.8% | 9.8% |
| Median | 12.9% | 8.9% |
| Interquartile 25% (IQ1) | 9.9% | 7.5% |
| Interquartile 75% (IQ3) | 15.9% | 10.1% |
| Interquartile Range (IQR) | 6.0% | 2.5% |
| Standard Deviation (Sample) | 6.9% | 6.1% |
| Standard Deviation (Population) | 6.8% | 6.1% |
Similar Demographics by Male Poverty
Demographics Similar to French American Indians by Male Poverty
In terms of male poverty, the demographic groups most similar to French American Indians are Ecuadorian (12.7%, a difference of 0.030%), Ghanaian (12.7%, a difference of 0.030%), Immigrants from Saudi Arabia (12.7%, a difference of 0.050%), Immigrants from Laos (12.6%, a difference of 0.29%), and Immigrants from Middle Africa (12.7%, a difference of 0.31%).
| Demographics | Rating | Rank | Male Poverty |
| Marshallese | 0.8 /100 | #230 | Tragic 12.5% |
| Salvadorans | 0.6 /100 | #231 | Tragic 12.6% |
| Nicaraguans | 0.6 /100 | #232 | Tragic 12.6% |
| Fijians | 0.6 /100 | #233 | Tragic 12.6% |
| Immigrants | Armenia | 0.6 /100 | #234 | Tragic 12.6% |
| Immigrants | Laos | 0.5 /100 | #235 | Tragic 12.6% |
| Immigrants | Saudi Arabia | 0.4 /100 | #236 | Tragic 12.7% |
| French American Indians | 0.4 /100 | #237 | Tragic 12.7% |
| Ecuadorians | 0.4 /100 | #238 | Tragic 12.7% |
| Ghanaians | 0.4 /100 | #239 | Tragic 12.7% |
| Immigrants | Middle Africa | 0.4 /100 | #240 | Tragic 12.7% |
| Sudanese | 0.3 /100 | #241 | Tragic 12.8% |
| Nepalese | 0.3 /100 | #242 | Tragic 12.8% |
| Alaskan Athabascans | 0.3 /100 | #243 | Tragic 12.8% |
| Tsimshian | 0.3 /100 | #244 | Tragic 12.8% |
Demographics Similar to Norwegians by Male Poverty
In terms of male poverty, the demographic groups most similar to Norwegians are Luxembourger (9.5%, a difference of 0.13%), Lithuanian (9.5%, a difference of 0.17%), Immigrants from Hong Kong (9.6%, a difference of 0.35%), Latvian (9.6%, a difference of 0.45%), and Bhutanese (9.5%, a difference of 0.65%).
| Demographics | Rating | Rank | Male Poverty |
| Bulgarians | 99.9 /100 | #10 | Exceptional 9.3% |
| Bolivians | 99.9 /100 | #11 | Exceptional 9.4% |
| Immigrants | Bolivia | 99.9 /100 | #12 | Exceptional 9.4% |
| Immigrants | Lithuania | 99.9 /100 | #13 | Exceptional 9.4% |
| Immigrants | North Macedonia | 99.8 /100 | #14 | Exceptional 9.4% |
| Bhutanese | 99.8 /100 | #15 | Exceptional 9.5% |
| Luxembourgers | 99.8 /100 | #16 | Exceptional 9.5% |
| Norwegians | 99.8 /100 | #17 | Exceptional 9.5% |
| Lithuanians | 99.8 /100 | #18 | Exceptional 9.5% |
| Immigrants | Hong Kong | 99.7 /100 | #19 | Exceptional 9.6% |
| Latvians | 99.7 /100 | #20 | Exceptional 9.6% |
| Immigrants | Scotland | 99.7 /100 | #21 | Exceptional 9.6% |
| Croatians | 99.7 /100 | #22 | Exceptional 9.6% |
| Italians | 99.7 /100 | #23 | Exceptional 9.6% |
| Swedes | 99.7 /100 | #24 | Exceptional 9.6% |