Immigrants from Belarus vs Norwegian Male Poverty
COMPARE
Immigrants from Belarus
Norwegian
Male Poverty
Male Poverty Comparison
Immigrants from Belarus
Norwegians
10.7%
MALE POVERTY
83.3/ 100
METRIC RATING
131st/ 347
METRIC RANK
9.5%
MALE POVERTY
99.8/ 100
METRIC RATING
17th/ 347
METRIC RANK
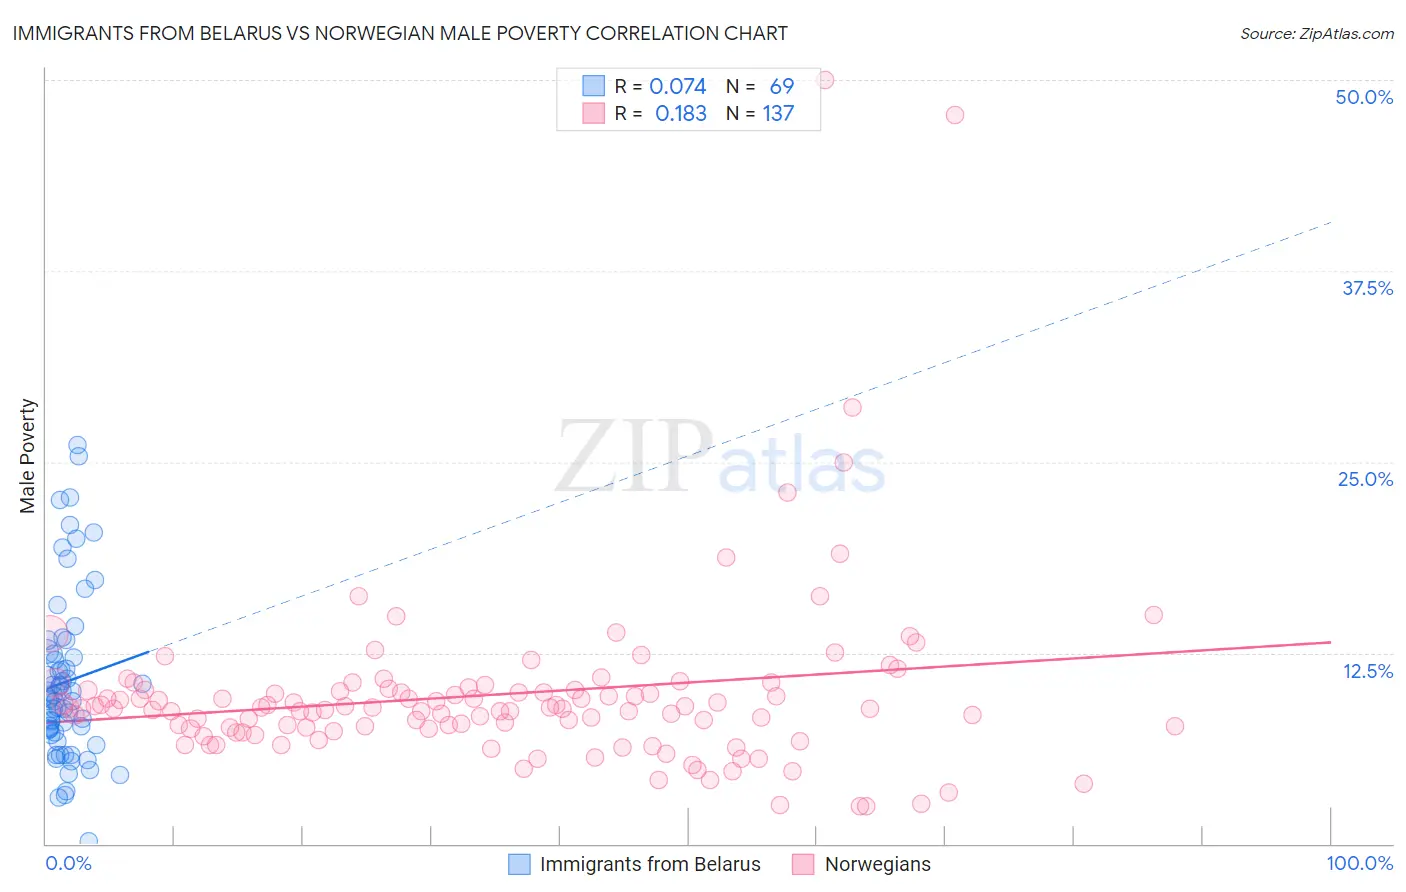
Immigrants from Belarus vs Norwegian Male Poverty Correlation Chart
The statistical analysis conducted on geographies consisting of 150,164,106 people shows a slight positive correlation between the proportion of Immigrants from Belarus and poverty level among males in the United States with a correlation coefficient (R) of 0.074 and weighted average of 10.7%. Similarly, the statistical analysis conducted on geographies consisting of 532,206,209 people shows a poor positive correlation between the proportion of Norwegians and poverty level among males in the United States with a correlation coefficient (R) of 0.183 and weighted average of 9.5%, a difference of 12.8%.
Male Poverty Correlation Summary
| Measurement | Immigrants from Belarus | Norwegian |
| Minimum | 0.12% | 2.4% |
| Maximum | 26.1% | 50.0% |
| Range | 25.9% | 47.6% |
| Mean | 10.6% | 9.8% |
| Median | 9.5% | 8.9% |
| Interquartile 25% (IQ1) | 7.2% | 7.5% |
| Interquartile 75% (IQ3) | 12.5% | 10.1% |
| Interquartile Range (IQR) | 5.3% | 2.5% |
| Standard Deviation (Sample) | 5.5% | 6.1% |
| Standard Deviation (Population) | 5.4% | 6.1% |
Similar Demographics by Male Poverty
Demographics Similar to Immigrants from Belarus by Male Poverty
In terms of male poverty, the demographic groups most similar to Immigrants from Belarus are Immigrants from Vietnam (10.8%, a difference of 0.050%), Pakistani (10.8%, a difference of 0.060%), New Zealander (10.8%, a difference of 0.070%), Chilean (10.7%, a difference of 0.11%), and Brazilian (10.8%, a difference of 0.11%).
| Demographics | Rating | Rank | Male Poverty |
| French | 86.7 /100 | #124 | Excellent 10.7% |
| Immigrants | Norway | 86.0 /100 | #125 | Excellent 10.7% |
| Immigrants | Ukraine | 84.3 /100 | #126 | Excellent 10.7% |
| Puget Sound Salish | 84.3 /100 | #127 | Excellent 10.7% |
| Immigrants | Western Europe | 84.2 /100 | #128 | Excellent 10.7% |
| Immigrants | Peru | 84.1 /100 | #129 | Excellent 10.7% |
| Chileans | 83.9 /100 | #130 | Excellent 10.7% |
| Immigrants | Belarus | 83.3 /100 | #131 | Excellent 10.7% |
| Immigrants | Vietnam | 83.0 /100 | #132 | Excellent 10.8% |
| Pakistanis | 83.0 /100 | #133 | Excellent 10.8% |
| New Zealanders | 82.9 /100 | #134 | Excellent 10.8% |
| Brazilians | 82.7 /100 | #135 | Excellent 10.8% |
| Immigrants | Israel | 80.9 /100 | #136 | Excellent 10.8% |
| Immigrants | Switzerland | 79.2 /100 | #137 | Good 10.8% |
| Yugoslavians | 78.2 /100 | #138 | Good 10.8% |
Demographics Similar to Norwegians by Male Poverty
In terms of male poverty, the demographic groups most similar to Norwegians are Luxembourger (9.5%, a difference of 0.13%), Lithuanian (9.5%, a difference of 0.17%), Immigrants from Hong Kong (9.6%, a difference of 0.35%), Latvian (9.6%, a difference of 0.45%), and Bhutanese (9.5%, a difference of 0.65%).
| Demographics | Rating | Rank | Male Poverty |
| Bulgarians | 99.9 /100 | #10 | Exceptional 9.3% |
| Bolivians | 99.9 /100 | #11 | Exceptional 9.4% |
| Immigrants | Bolivia | 99.9 /100 | #12 | Exceptional 9.4% |
| Immigrants | Lithuania | 99.9 /100 | #13 | Exceptional 9.4% |
| Immigrants | North Macedonia | 99.8 /100 | #14 | Exceptional 9.4% |
| Bhutanese | 99.8 /100 | #15 | Exceptional 9.5% |
| Luxembourgers | 99.8 /100 | #16 | Exceptional 9.5% |
| Norwegians | 99.8 /100 | #17 | Exceptional 9.5% |
| Lithuanians | 99.8 /100 | #18 | Exceptional 9.5% |
| Immigrants | Hong Kong | 99.7 /100 | #19 | Exceptional 9.6% |
| Latvians | 99.7 /100 | #20 | Exceptional 9.6% |
| Immigrants | Scotland | 99.7 /100 | #21 | Exceptional 9.6% |
| Croatians | 99.7 /100 | #22 | Exceptional 9.6% |
| Italians | 99.7 /100 | #23 | Exceptional 9.6% |
| Swedes | 99.7 /100 | #24 | Exceptional 9.6% |