Hispanic or Latino vs Norwegian Male Poverty
COMPARE
Hispanic or Latino
Norwegian
Male Poverty
Male Poverty Comparison
Hispanics or Latinos
Norwegians
13.9%
MALE POVERTY
0.0/ 100
METRIC RATING
294th/ 347
METRIC RANK
9.5%
MALE POVERTY
99.8/ 100
METRIC RATING
17th/ 347
METRIC RANK
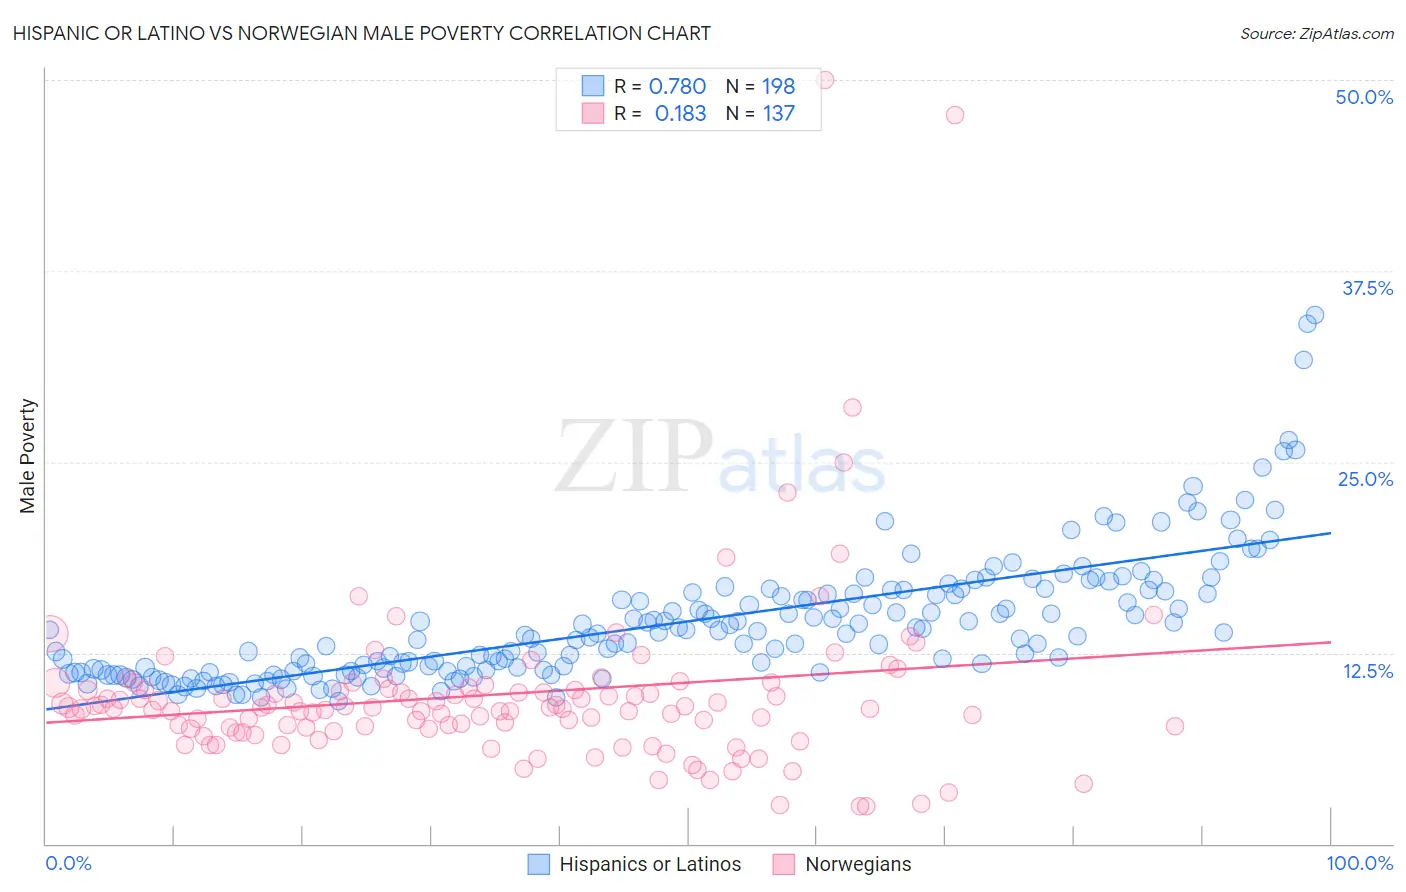
Hispanic or Latino vs Norwegian Male Poverty Correlation Chart
The statistical analysis conducted on geographies consisting of 573,631,780 people shows a strong positive correlation between the proportion of Hispanics or Latinos and poverty level among males in the United States with a correlation coefficient (R) of 0.780 and weighted average of 13.9%. Similarly, the statistical analysis conducted on geographies consisting of 532,206,209 people shows a poor positive correlation between the proportion of Norwegians and poverty level among males in the United States with a correlation coefficient (R) of 0.183 and weighted average of 9.5%, a difference of 45.4%.
Male Poverty Correlation Summary
| Measurement | Hispanic or Latino | Norwegian |
| Minimum | 9.3% | 2.4% |
| Maximum | 34.6% | 50.0% |
| Range | 25.3% | 47.6% |
| Mean | 14.5% | 9.8% |
| Median | 13.7% | 8.9% |
| Interquartile 25% (IQ1) | 11.3% | 7.5% |
| Interquartile 75% (IQ3) | 16.4% | 10.1% |
| Interquartile Range (IQR) | 5.1% | 2.5% |
| Standard Deviation (Sample) | 4.2% | 6.1% |
| Standard Deviation (Population) | 4.2% | 6.1% |
Similar Demographics by Male Poverty
Demographics Similar to Hispanics or Latinos by Male Poverty
In terms of male poverty, the demographic groups most similar to Hispanics or Latinos are Immigrants from Belize (13.8%, a difference of 0.060%), Indonesian (13.8%, a difference of 0.070%), Vietnamese (13.8%, a difference of 0.24%), Immigrants from Central America (13.9%, a difference of 0.28%), and Immigrants from Zaire (13.8%, a difference of 0.32%).
| Demographics | Rating | Rank | Male Poverty |
| Immigrants | Barbados | 0.0 /100 | #287 | Tragic 13.8% |
| Immigrants | St. Vincent and the Grenadines | 0.0 /100 | #288 | Tragic 13.8% |
| Guatemalans | 0.0 /100 | #289 | Tragic 13.8% |
| Immigrants | Zaire | 0.0 /100 | #290 | Tragic 13.8% |
| Vietnamese | 0.0 /100 | #291 | Tragic 13.8% |
| Indonesians | 0.0 /100 | #292 | Tragic 13.8% |
| Immigrants | Belize | 0.0 /100 | #293 | Tragic 13.8% |
| Hispanics or Latinos | 0.0 /100 | #294 | Tragic 13.9% |
| Immigrants | Central America | 0.0 /100 | #295 | Tragic 13.9% |
| Cajuns | 0.0 /100 | #296 | Tragic 13.9% |
| Inupiat | 0.0 /100 | #297 | Tragic 14.0% |
| Blackfeet | 0.0 /100 | #298 | Tragic 14.0% |
| Immigrants | Guatemala | 0.0 /100 | #299 | Tragic 14.0% |
| Immigrants | Mexico | 0.0 /100 | #300 | Tragic 14.0% |
| Immigrants | Senegal | 0.0 /100 | #301 | Tragic 14.0% |
Demographics Similar to Norwegians by Male Poverty
In terms of male poverty, the demographic groups most similar to Norwegians are Luxembourger (9.5%, a difference of 0.13%), Lithuanian (9.5%, a difference of 0.17%), Immigrants from Hong Kong (9.6%, a difference of 0.35%), Latvian (9.6%, a difference of 0.45%), and Bhutanese (9.5%, a difference of 0.65%).
| Demographics | Rating | Rank | Male Poverty |
| Bulgarians | 99.9 /100 | #10 | Exceptional 9.3% |
| Bolivians | 99.9 /100 | #11 | Exceptional 9.4% |
| Immigrants | Bolivia | 99.9 /100 | #12 | Exceptional 9.4% |
| Immigrants | Lithuania | 99.9 /100 | #13 | Exceptional 9.4% |
| Immigrants | North Macedonia | 99.8 /100 | #14 | Exceptional 9.4% |
| Bhutanese | 99.8 /100 | #15 | Exceptional 9.5% |
| Luxembourgers | 99.8 /100 | #16 | Exceptional 9.5% |
| Norwegians | 99.8 /100 | #17 | Exceptional 9.5% |
| Lithuanians | 99.8 /100 | #18 | Exceptional 9.5% |
| Immigrants | Hong Kong | 99.7 /100 | #19 | Exceptional 9.6% |
| Latvians | 99.7 /100 | #20 | Exceptional 9.6% |
| Immigrants | Scotland | 99.7 /100 | #21 | Exceptional 9.6% |
| Croatians | 99.7 /100 | #22 | Exceptional 9.6% |
| Italians | 99.7 /100 | #23 | Exceptional 9.6% |
| Swedes | 99.7 /100 | #24 | Exceptional 9.6% |