Immigrants from Thailand vs Norwegian Male Poverty
COMPARE
Immigrants from Thailand
Norwegian
Male Poverty
Male Poverty Comparison
Immigrants from Thailand
Norwegians
12.2%
MALE POVERTY
2.5/ 100
METRIC RATING
217th/ 347
METRIC RANK
9.5%
MALE POVERTY
99.8/ 100
METRIC RATING
17th/ 347
METRIC RANK
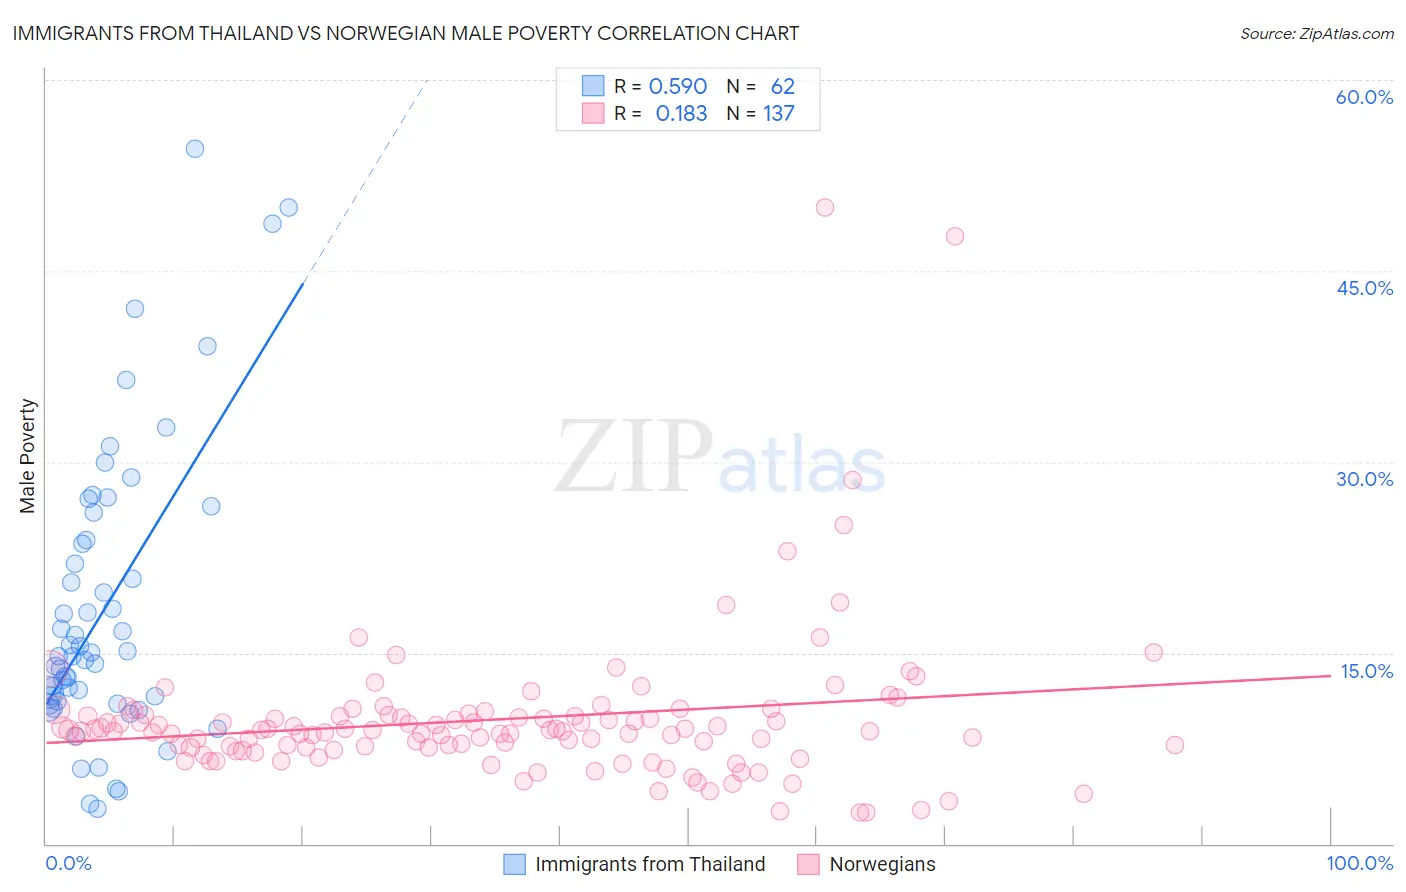
Immigrants from Thailand vs Norwegian Male Poverty Correlation Chart
The statistical analysis conducted on geographies consisting of 316,895,557 people shows a substantial positive correlation between the proportion of Immigrants from Thailand and poverty level among males in the United States with a correlation coefficient (R) of 0.590 and weighted average of 12.2%. Similarly, the statistical analysis conducted on geographies consisting of 532,206,209 people shows a poor positive correlation between the proportion of Norwegians and poverty level among males in the United States with a correlation coefficient (R) of 0.183 and weighted average of 9.5%, a difference of 28.0%.
Male Poverty Correlation Summary
| Measurement | Immigrants from Thailand | Norwegian |
| Minimum | 2.7% | 2.4% |
| Maximum | 54.6% | 50.0% |
| Range | 51.9% | 47.6% |
| Mean | 18.5% | 9.8% |
| Median | 14.9% | 8.9% |
| Interquartile 25% (IQ1) | 11.2% | 7.5% |
| Interquartile 75% (IQ3) | 23.8% | 10.1% |
| Interquartile Range (IQR) | 12.6% | 2.5% |
| Standard Deviation (Sample) | 11.4% | 6.1% |
| Standard Deviation (Population) | 11.3% | 6.1% |
Similar Demographics by Male Poverty
Demographics Similar to Immigrants from Thailand by Male Poverty
In terms of male poverty, the demographic groups most similar to Immigrants from Thailand are Immigrants from Cambodia (12.2%, a difference of 0.010%), German Russian (12.2%, a difference of 0.020%), Immigrants from Uzbekistan (12.2%, a difference of 0.090%), Bermudan (12.2%, a difference of 0.090%), and Immigrants from Eritrea (12.2%, a difference of 0.11%).
| Demographics | Rating | Rank | Male Poverty |
| Moroccans | 4.2 /100 | #210 | Tragic 12.0% |
| Immigrants | Panama | 4.0 /100 | #211 | Tragic 12.1% |
| Americans | 3.2 /100 | #212 | Tragic 12.1% |
| Immigrants | Nonimmigrants | 3.1 /100 | #213 | Tragic 12.1% |
| Japanese | 2.7 /100 | #214 | Tragic 12.2% |
| Immigrants | Uzbekistan | 2.6 /100 | #215 | Tragic 12.2% |
| Immigrants | Cambodia | 2.5 /100 | #216 | Tragic 12.2% |
| Immigrants | Thailand | 2.5 /100 | #217 | Tragic 12.2% |
| German Russians | 2.5 /100 | #218 | Tragic 12.2% |
| Bermudans | 2.4 /100 | #219 | Tragic 12.2% |
| Immigrants | Eritrea | 2.4 /100 | #220 | Tragic 12.2% |
| Ugandans | 2.2 /100 | #221 | Tragic 12.2% |
| Immigrants | Africa | 2.1 /100 | #222 | Tragic 12.2% |
| Immigrants | Micronesia | 2.1 /100 | #223 | Tragic 12.2% |
| Immigrants | Nigeria | 1.6 /100 | #224 | Tragic 12.3% |
Demographics Similar to Norwegians by Male Poverty
In terms of male poverty, the demographic groups most similar to Norwegians are Luxembourger (9.5%, a difference of 0.13%), Lithuanian (9.5%, a difference of 0.17%), Immigrants from Hong Kong (9.6%, a difference of 0.35%), Latvian (9.6%, a difference of 0.45%), and Bhutanese (9.5%, a difference of 0.65%).
| Demographics | Rating | Rank | Male Poverty |
| Bulgarians | 99.9 /100 | #10 | Exceptional 9.3% |
| Bolivians | 99.9 /100 | #11 | Exceptional 9.4% |
| Immigrants | Bolivia | 99.9 /100 | #12 | Exceptional 9.4% |
| Immigrants | Lithuania | 99.9 /100 | #13 | Exceptional 9.4% |
| Immigrants | North Macedonia | 99.8 /100 | #14 | Exceptional 9.4% |
| Bhutanese | 99.8 /100 | #15 | Exceptional 9.5% |
| Luxembourgers | 99.8 /100 | #16 | Exceptional 9.5% |
| Norwegians | 99.8 /100 | #17 | Exceptional 9.5% |
| Lithuanians | 99.8 /100 | #18 | Exceptional 9.5% |
| Immigrants | Hong Kong | 99.7 /100 | #19 | Exceptional 9.6% |
| Latvians | 99.7 /100 | #20 | Exceptional 9.6% |
| Immigrants | Scotland | 99.7 /100 | #21 | Exceptional 9.6% |
| Croatians | 99.7 /100 | #22 | Exceptional 9.6% |
| Italians | 99.7 /100 | #23 | Exceptional 9.6% |
| Swedes | 99.7 /100 | #24 | Exceptional 9.6% |