Immigrants from Thailand vs Immigrants from Sierra Leone Doctorate Degree
COMPARE
Immigrants from Thailand
Immigrants from Sierra Leone
Doctorate Degree
Doctorate Degree Comparison
Immigrants from Thailand
Immigrants from Sierra Leone
1.8%
DOCTORATE DEGREE
49.4/ 100
METRIC RATING
175th/ 347
METRIC RANK
2.0%
DOCTORATE DEGREE
90.2/ 100
METRIC RATING
131st/ 347
METRIC RANK
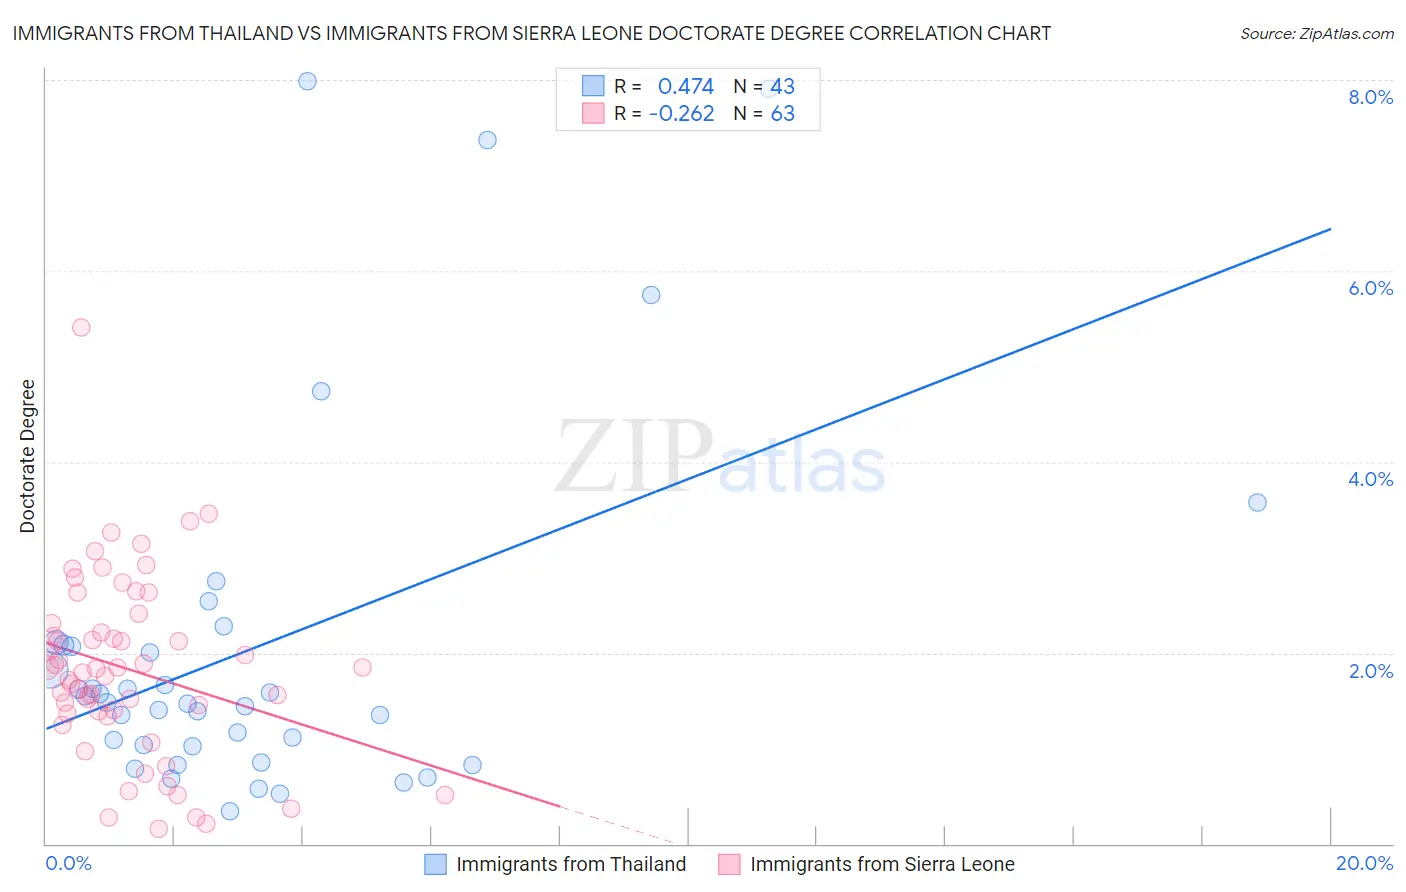
Immigrants from Thailand vs Immigrants from Sierra Leone Doctorate Degree Correlation Chart
The statistical analysis conducted on geographies consisting of 315,045,663 people shows a moderate positive correlation between the proportion of Immigrants from Thailand and percentage of population with at least doctorate degree education in the United States with a correlation coefficient (R) of 0.474 and weighted average of 1.8%. Similarly, the statistical analysis conducted on geographies consisting of 101,401,278 people shows a weak negative correlation between the proportion of Immigrants from Sierra Leone and percentage of population with at least doctorate degree education in the United States with a correlation coefficient (R) of -0.262 and weighted average of 2.0%, a difference of 8.2%.
Doctorate Degree Correlation Summary
| Measurement | Immigrants from Thailand | Immigrants from Sierra Leone |
| Minimum | 0.35% | 0.15% |
| Maximum | 8.0% | 5.4% |
| Range | 7.6% | 5.3% |
| Mean | 2.1% | 1.8% |
| Median | 1.5% | 1.8% |
| Interquartile 25% (IQ1) | 1.0% | 1.4% |
| Interquartile 75% (IQ3) | 2.1% | 2.3% |
| Interquartile Range (IQR) | 1.1% | 0.95% |
| Standard Deviation (Sample) | 1.9% | 0.95% |
| Standard Deviation (Population) | 1.9% | 0.94% |
Similar Demographics by Doctorate Degree
Demographics Similar to Immigrants from Thailand by Doctorate Degree
In terms of doctorate degree, the demographic groups most similar to Immigrants from Thailand are Spanish (1.8%, a difference of 0.020%), Iraqi (1.8%, a difference of 0.030%), Immigrants from Bangladesh (1.8%, a difference of 0.080%), Norwegian (1.8%, a difference of 0.090%), and French (1.8%, a difference of 0.090%).
| Demographics | Rating | Rank | Doctorate Degree |
| Sri Lankans | 60.3 /100 | #168 | Good 1.9% |
| Vietnamese | 54.8 /100 | #169 | Average 1.9% |
| Costa Ricans | 53.3 /100 | #170 | Average 1.8% |
| Bermudans | 52.1 /100 | #171 | Average 1.8% |
| Belgians | 50.3 /100 | #172 | Average 1.8% |
| Norwegians | 50.0 /100 | #173 | Average 1.8% |
| Immigrants | Bangladesh | 50.0 /100 | #174 | Average 1.8% |
| Immigrants | Thailand | 49.4 /100 | #175 | Average 1.8% |
| Spanish | 49.3 /100 | #176 | Average 1.8% |
| Iraqis | 49.2 /100 | #177 | Average 1.8% |
| French | 48.8 /100 | #178 | Average 1.8% |
| Ghanaians | 48.3 /100 | #179 | Average 1.8% |
| Scandinavians | 48.0 /100 | #180 | Average 1.8% |
| Immigrants | Immigrants | 46.2 /100 | #181 | Average 1.8% |
| Immigrants | Afghanistan | 44.3 /100 | #182 | Average 1.8% |
Demographics Similar to Immigrants from Sierra Leone by Doctorate Degree
In terms of doctorate degree, the demographic groups most similar to Immigrants from Sierra Leone are Canadian (2.0%, a difference of 0.14%), Immigrants from Ukraine (2.0%, a difference of 0.14%), Scottish (2.0%, a difference of 0.28%), Immigrants from Uzbekistan (2.0%, a difference of 0.33%), and Immigrants from Zaire (2.0%, a difference of 0.36%).
| Demographics | Rating | Rank | Doctorate Degree |
| Ute | 93.2 /100 | #124 | Exceptional 2.0% |
| Moroccans | 93.0 /100 | #125 | Exceptional 2.0% |
| Jordanians | 92.1 /100 | #126 | Exceptional 2.0% |
| Palestinians | 92.0 /100 | #127 | Exceptional 2.0% |
| Immigrants | Zaire | 91.1 /100 | #128 | Exceptional 2.0% |
| Canadians | 90.6 /100 | #129 | Exceptional 2.0% |
| Immigrants | Ukraine | 90.5 /100 | #130 | Exceptional 2.0% |
| Immigrants | Sierra Leone | 90.2 /100 | #131 | Exceptional 2.0% |
| Scottish | 89.4 /100 | #132 | Excellent 2.0% |
| Immigrants | Uzbekistan | 89.3 /100 | #133 | Excellent 2.0% |
| Immigrants | Cameroon | 88.9 /100 | #134 | Excellent 2.0% |
| Serbians | 88.7 /100 | #135 | Excellent 2.0% |
| Swedes | 88.3 /100 | #136 | Excellent 2.0% |
| South American Indians | 88.3 /100 | #137 | Excellent 2.0% |
| Swiss | 88.0 /100 | #138 | Excellent 2.0% |