Immigrants from Taiwan vs Yakama Male Poverty
COMPARE
Immigrants from Taiwan
Yakama
Male Poverty
Male Poverty Comparison
Immigrants from Taiwan
Yakama
8.9%
MALE POVERTY
100.0/ 100
METRIC RATING
4th/ 347
METRIC RANK
15.3%
MALE POVERTY
0.0/ 100
METRIC RATING
325th/ 347
METRIC RANK
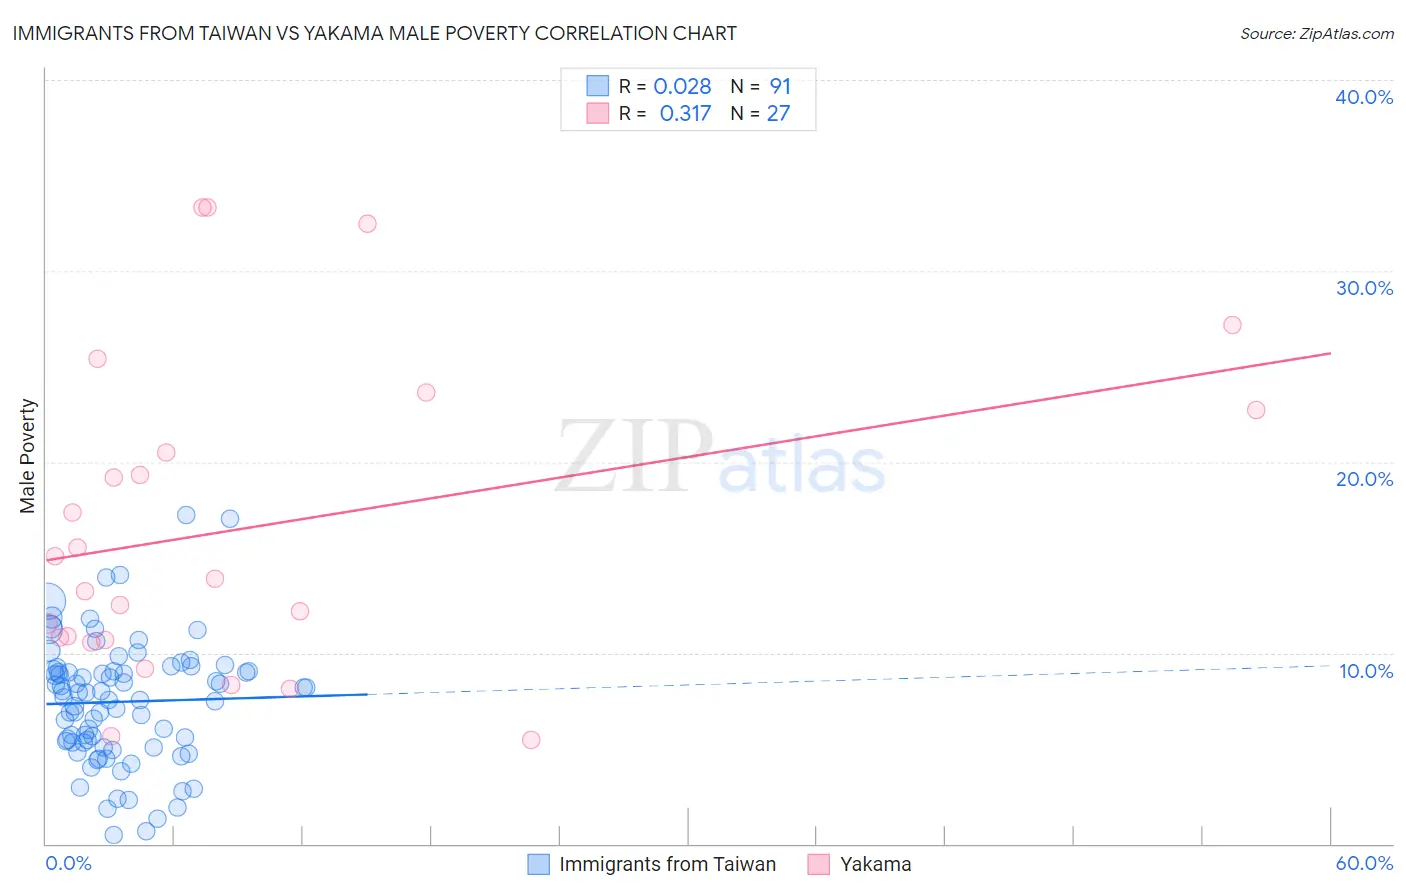
Immigrants from Taiwan vs Yakama Male Poverty Correlation Chart
The statistical analysis conducted on geographies consisting of 298,036,571 people shows no correlation between the proportion of Immigrants from Taiwan and poverty level among males in the United States with a correlation coefficient (R) of 0.028 and weighted average of 8.9%. Similarly, the statistical analysis conducted on geographies consisting of 19,917,879 people shows a mild positive correlation between the proportion of Yakama and poverty level among males in the United States with a correlation coefficient (R) of 0.317 and weighted average of 15.3%, a difference of 72.0%.
Male Poverty Correlation Summary
| Measurement | Immigrants from Taiwan | Yakama |
| Minimum | 0.43% | 5.5% |
| Maximum | 17.2% | 33.3% |
| Range | 16.8% | 27.9% |
| Mean | 7.4% | 16.6% |
| Median | 7.9% | 13.8% |
| Interquartile 25% (IQ1) | 5.3% | 10.7% |
| Interquartile 75% (IQ3) | 9.1% | 22.7% |
| Interquartile Range (IQR) | 3.8% | 12.1% |
| Standard Deviation (Sample) | 3.2% | 8.3% |
| Standard Deviation (Population) | 3.2% | 8.1% |
Similar Demographics by Male Poverty
Demographics Similar to Immigrants from Taiwan by Male Poverty
In terms of male poverty, the demographic groups most similar to Immigrants from Taiwan are Maltese (9.1%, a difference of 2.0%), Thai (8.7%, a difference of 2.3%), Chinese (8.7%, a difference of 2.4%), Assyrian/Chaldean/Syriac (9.1%, a difference of 2.7%), and Immigrants from Ireland (9.1%, a difference of 2.7%).
| Demographics | Rating | Rank | Male Poverty |
| Immigrants | India | 100.0 /100 | #1 | Exceptional 8.2% |
| Chinese | 100.0 /100 | #2 | Exceptional 8.7% |
| Thais | 100.0 /100 | #3 | Exceptional 8.7% |
| Immigrants | Taiwan | 100.0 /100 | #4 | Exceptional 8.9% |
| Maltese | 100.0 /100 | #5 | Exceptional 9.1% |
| Assyrians/Chaldeans/Syriacs | 99.9 /100 | #6 | Exceptional 9.1% |
| Immigrants | Ireland | 99.9 /100 | #7 | Exceptional 9.1% |
| Filipinos | 99.9 /100 | #8 | Exceptional 9.2% |
| Immigrants | South Central Asia | 99.9 /100 | #9 | Exceptional 9.3% |
| Bulgarians | 99.9 /100 | #10 | Exceptional 9.3% |
| Bolivians | 99.9 /100 | #11 | Exceptional 9.4% |
| Immigrants | Bolivia | 99.9 /100 | #12 | Exceptional 9.4% |
| Immigrants | Lithuania | 99.9 /100 | #13 | Exceptional 9.4% |
| Immigrants | North Macedonia | 99.8 /100 | #14 | Exceptional 9.4% |
| Bhutanese | 99.8 /100 | #15 | Exceptional 9.5% |
Demographics Similar to Yakama by Male Poverty
In terms of male poverty, the demographic groups most similar to Yakama are Central American Indian (15.3%, a difference of 0.11%), Menominee (15.3%, a difference of 0.18%), Colville (15.2%, a difference of 0.37%), Kiowa (15.2%, a difference of 0.76%), and Arapaho (15.1%, a difference of 1.5%).
| Demographics | Rating | Rank | Male Poverty |
| Immigrants | Grenada | 0.0 /100 | #318 | Tragic 14.7% |
| U.S. Virgin Islanders | 0.0 /100 | #319 | Tragic 14.7% |
| Immigrants | Congo | 0.0 /100 | #320 | Tragic 14.7% |
| Arapaho | 0.0 /100 | #321 | Tragic 15.1% |
| Kiowa | 0.0 /100 | #322 | Tragic 15.2% |
| Colville | 0.0 /100 | #323 | Tragic 15.2% |
| Menominee | 0.0 /100 | #324 | Tragic 15.3% |
| Yakama | 0.0 /100 | #325 | Tragic 15.3% |
| Central American Indians | 0.0 /100 | #326 | Tragic 15.3% |
| Paiute | 0.0 /100 | #327 | Tragic 15.8% |
| Blacks/African Americans | 0.0 /100 | #328 | Tragic 15.8% |
| Dominicans | 0.0 /100 | #329 | Tragic 16.1% |
| Immigrants | Dominican Republic | 0.0 /100 | #330 | Tragic 16.2% |
| Ute | 0.0 /100 | #331 | Tragic 16.2% |
| Houma | 0.0 /100 | #332 | Tragic 16.7% |