Immigrants from Zaire vs Asian Poverty
COMPARE
Immigrants from Zaire
Asian
Poverty
Poverty Comparison
Immigrants from Zaire
Asians
15.1%
POVERTY
0.0/ 100
METRIC RATING
293rd/ 347
METRIC RANK
11.0%
POVERTY
98.9/ 100
METRIC RATING
50th/ 347
METRIC RANK
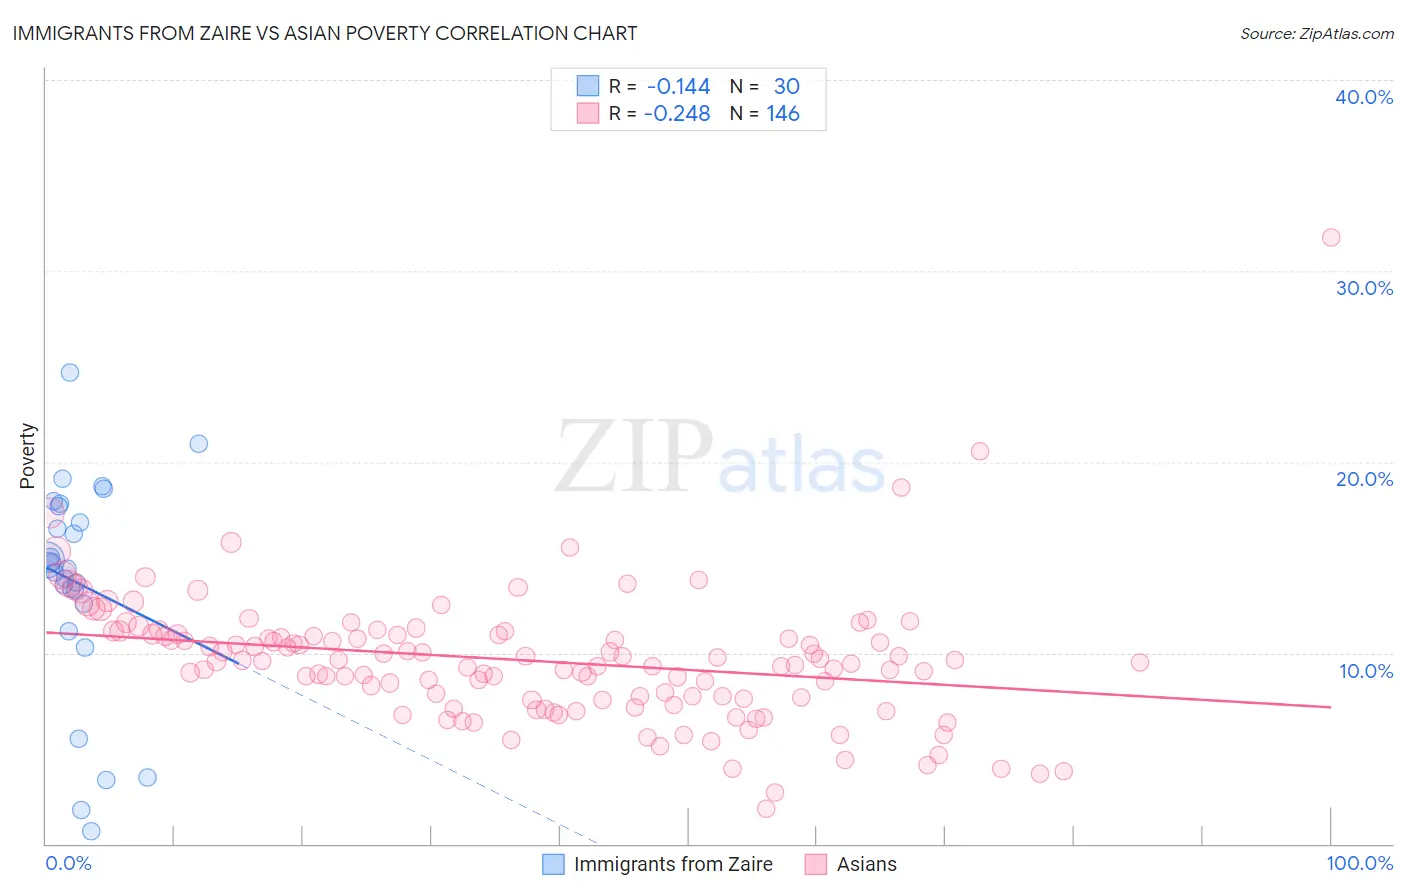
Immigrants from Zaire vs Asian Poverty Correlation Chart
The statistical analysis conducted on geographies consisting of 107,241,785 people shows a poor negative correlation between the proportion of Immigrants from Zaire and poverty level in the United States with a correlation coefficient (R) of -0.144 and weighted average of 15.1%. Similarly, the statistical analysis conducted on geographies consisting of 550,188,892 people shows a weak negative correlation between the proportion of Asians and poverty level in the United States with a correlation coefficient (R) of -0.248 and weighted average of 11.0%, a difference of 37.8%.
Poverty Correlation Summary
| Measurement | Immigrants from Zaire | Asian |
| Minimum | 0.62% | 1.8% |
| Maximum | 24.7% | 31.8% |
| Range | 24.1% | 29.9% |
| Mean | 13.7% | 9.6% |
| Median | 14.6% | 9.6% |
| Interquartile 25% (IQ1) | 12.6% | 7.6% |
| Interquartile 75% (IQ3) | 17.7% | 11.0% |
| Interquartile Range (IQR) | 5.1% | 3.4% |
| Standard Deviation (Sample) | 5.7% | 3.5% |
| Standard Deviation (Population) | 5.6% | 3.5% |
Similar Demographics by Poverty
Demographics Similar to Immigrants from Zaire by Poverty
In terms of poverty, the demographic groups most similar to Immigrants from Zaire are Indonesian (15.1%, a difference of 0.010%), Immigrants from Cabo Verde (15.1%, a difference of 0.060%), Mexican (15.1%, a difference of 0.18%), Immigrants from Belize (15.1%, a difference of 0.29%), and Yaqui (15.1%, a difference of 0.40%).
| Demographics | Rating | Rank | Poverty |
| Immigrants | Latin America | 0.0 /100 | #286 | Tragic 15.0% |
| Inupiat | 0.0 /100 | #287 | Tragic 15.1% |
| Yaqui | 0.0 /100 | #288 | Tragic 15.1% |
| Immigrants | Belize | 0.0 /100 | #289 | Tragic 15.1% |
| Mexicans | 0.0 /100 | #290 | Tragic 15.1% |
| Immigrants | Cabo Verde | 0.0 /100 | #291 | Tragic 15.1% |
| Indonesians | 0.0 /100 | #292 | Tragic 15.1% |
| Immigrants | Zaire | 0.0 /100 | #293 | Tragic 15.1% |
| Blackfeet | 0.0 /100 | #294 | Tragic 15.2% |
| Guatemalans | 0.0 /100 | #295 | Tragic 15.3% |
| Hispanics or Latinos | 0.0 /100 | #296 | Tragic 15.3% |
| Immigrants | Bangladesh | 0.0 /100 | #297 | Tragic 15.3% |
| Immigrants | Senegal | 0.0 /100 | #298 | Tragic 15.3% |
| Senegalese | 0.0 /100 | #299 | Tragic 15.3% |
| Immigrants | Central America | 0.0 /100 | #300 | Tragic 15.4% |
Demographics Similar to Asians by Poverty
In terms of poverty, the demographic groups most similar to Asians are Immigrants from Japan (11.0%, a difference of 0.030%), Slovene (11.0%, a difference of 0.040%), Immigrants from Romania (11.0%, a difference of 0.080%), Immigrants from Czechoslovakia (11.0%, a difference of 0.10%), and Turkish (11.0%, a difference of 0.18%).
| Demographics | Rating | Rank | Poverty |
| Immigrants | Singapore | 99.2 /100 | #43 | Exceptional 10.9% |
| Immigrants | Moldova | 99.1 /100 | #44 | Exceptional 10.9% |
| Turks | 98.9 /100 | #45 | Exceptional 11.0% |
| Immigrants | Czechoslovakia | 98.9 /100 | #46 | Exceptional 11.0% |
| Immigrants | Romania | 98.9 /100 | #47 | Exceptional 11.0% |
| Slovenes | 98.9 /100 | #48 | Exceptional 11.0% |
| Immigrants | Japan | 98.9 /100 | #49 | Exceptional 11.0% |
| Asians | 98.9 /100 | #50 | Exceptional 11.0% |
| Immigrants | Croatia | 98.7 /100 | #51 | Exceptional 11.0% |
| Immigrants | Philippines | 98.7 /100 | #52 | Exceptional 11.0% |
| Immigrants | Austria | 98.6 /100 | #53 | Exceptional 11.1% |
| Immigrants | Bulgaria | 98.5 /100 | #54 | Exceptional 11.1% |
| Immigrants | Serbia | 98.5 /100 | #55 | Exceptional 11.1% |
| Estonians | 98.2 /100 | #56 | Exceptional 11.1% |
| Scandinavians | 98.2 /100 | #57 | Exceptional 11.1% |