Slovak vs Asian Poverty
COMPARE
Slovak
Asian
Poverty
Poverty Comparison
Slovaks
Asians
11.2%
POVERTY
97.4/ 100
METRIC RATING
68th/ 347
METRIC RANK
11.0%
POVERTY
98.9/ 100
METRIC RATING
50th/ 347
METRIC RANK
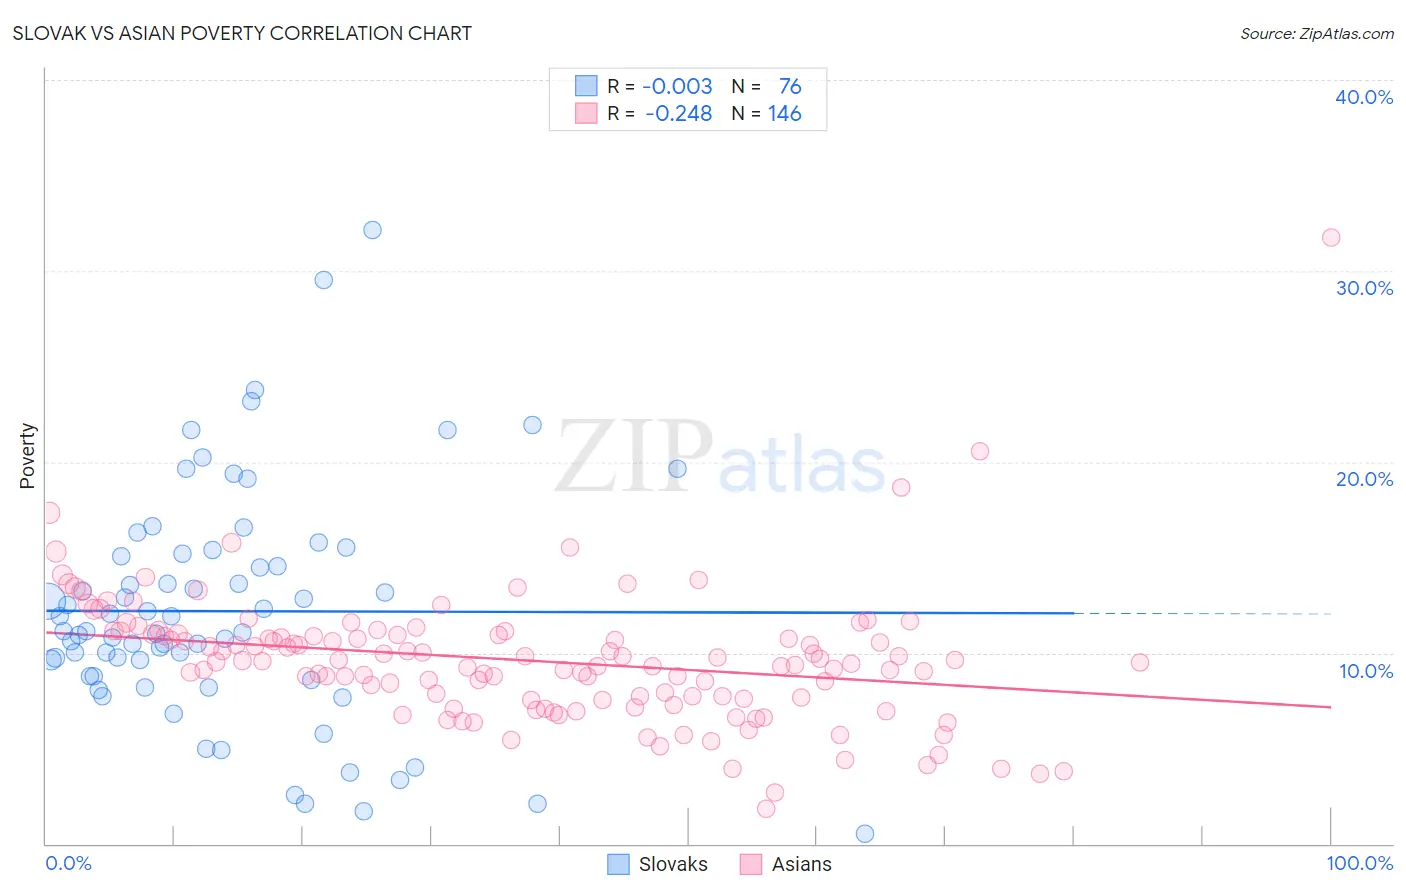
Slovak vs Asian Poverty Correlation Chart
The statistical analysis conducted on geographies consisting of 397,661,744 people shows no correlation between the proportion of Slovaks and poverty level in the United States with a correlation coefficient (R) of -0.003 and weighted average of 11.2%. Similarly, the statistical analysis conducted on geographies consisting of 550,188,892 people shows a weak negative correlation between the proportion of Asians and poverty level in the United States with a correlation coefficient (R) of -0.248 and weighted average of 11.0%, a difference of 2.3%.
Poverty Correlation Summary
| Measurement | Slovak | Asian |
| Minimum | 0.55% | 1.8% |
| Maximum | 32.2% | 31.8% |
| Range | 31.6% | 29.9% |
| Mean | 12.2% | 9.6% |
| Median | 11.1% | 9.6% |
| Interquartile 25% (IQ1) | 8.8% | 7.6% |
| Interquartile 75% (IQ3) | 15.1% | 11.0% |
| Interquartile Range (IQR) | 6.4% | 3.4% |
| Standard Deviation (Sample) | 6.1% | 3.5% |
| Standard Deviation (Population) | 6.0% | 3.5% |
Demographics Similar to Slovaks and Asians by Poverty
In terms of poverty, the demographic groups most similar to Slovaks are Immigrants from Australia (11.2%, a difference of 0.020%), Immigrants from Netherlands (11.2%, a difference of 0.060%), Serbian (11.2%, a difference of 0.060%), Immigrants from Asia (11.2%, a difference of 0.13%), and Swiss (11.2%, a difference of 0.26%). Similarly, the demographic groups most similar to Asians are Immigrants from Japan (11.0%, a difference of 0.030%), Immigrants from Croatia (11.0%, a difference of 0.41%), Immigrants from Philippines (11.0%, a difference of 0.42%), Immigrants from Austria (11.1%, a difference of 0.65%), and Immigrants from Bulgaria (11.1%, a difference of 0.77%).
| Demographics | Rating | Rank | Poverty |
| Immigrants | Japan | 98.9 /100 | #49 | Exceptional 11.0% |
| Asians | 98.9 /100 | #50 | Exceptional 11.0% |
| Immigrants | Croatia | 98.7 /100 | #51 | Exceptional 11.0% |
| Immigrants | Philippines | 98.7 /100 | #52 | Exceptional 11.0% |
| Immigrants | Austria | 98.6 /100 | #53 | Exceptional 11.1% |
| Immigrants | Bulgaria | 98.5 /100 | #54 | Exceptional 11.1% |
| Immigrants | Serbia | 98.5 /100 | #55 | Exceptional 11.1% |
| Estonians | 98.2 /100 | #56 | Exceptional 11.1% |
| Scandinavians | 98.2 /100 | #57 | Exceptional 11.1% |
| Germans | 98.1 /100 | #58 | Exceptional 11.1% |
| Immigrants | Europe | 98.0 /100 | #59 | Exceptional 11.2% |
| Immigrants | Sri Lanka | 97.9 /100 | #60 | Exceptional 11.2% |
| Immigrants | Italy | 97.9 /100 | #61 | Exceptional 11.2% |
| Austrians | 97.8 /100 | #62 | Exceptional 11.2% |
| Ukrainians | 97.8 /100 | #63 | Exceptional 11.2% |
| Swiss | 97.7 /100 | #64 | Exceptional 11.2% |
| Immigrants | Asia | 97.5 /100 | #65 | Exceptional 11.2% |
| Immigrants | Netherlands | 97.5 /100 | #66 | Exceptional 11.2% |
| Immigrants | Australia | 97.4 /100 | #67 | Exceptional 11.2% |
| Slovaks | 97.4 /100 | #68 | Exceptional 11.2% |
| Serbians | 97.4 /100 | #69 | Exceptional 11.2% |