Celtic vs Asian Poverty
COMPARE
Celtic
Asian
Poverty
Poverty Comparison
Celtics
Asians
12.3%
POVERTY
50.1/ 100
METRIC RATING
173rd/ 347
METRIC RANK
11.0%
POVERTY
98.9/ 100
METRIC RATING
50th/ 347
METRIC RANK
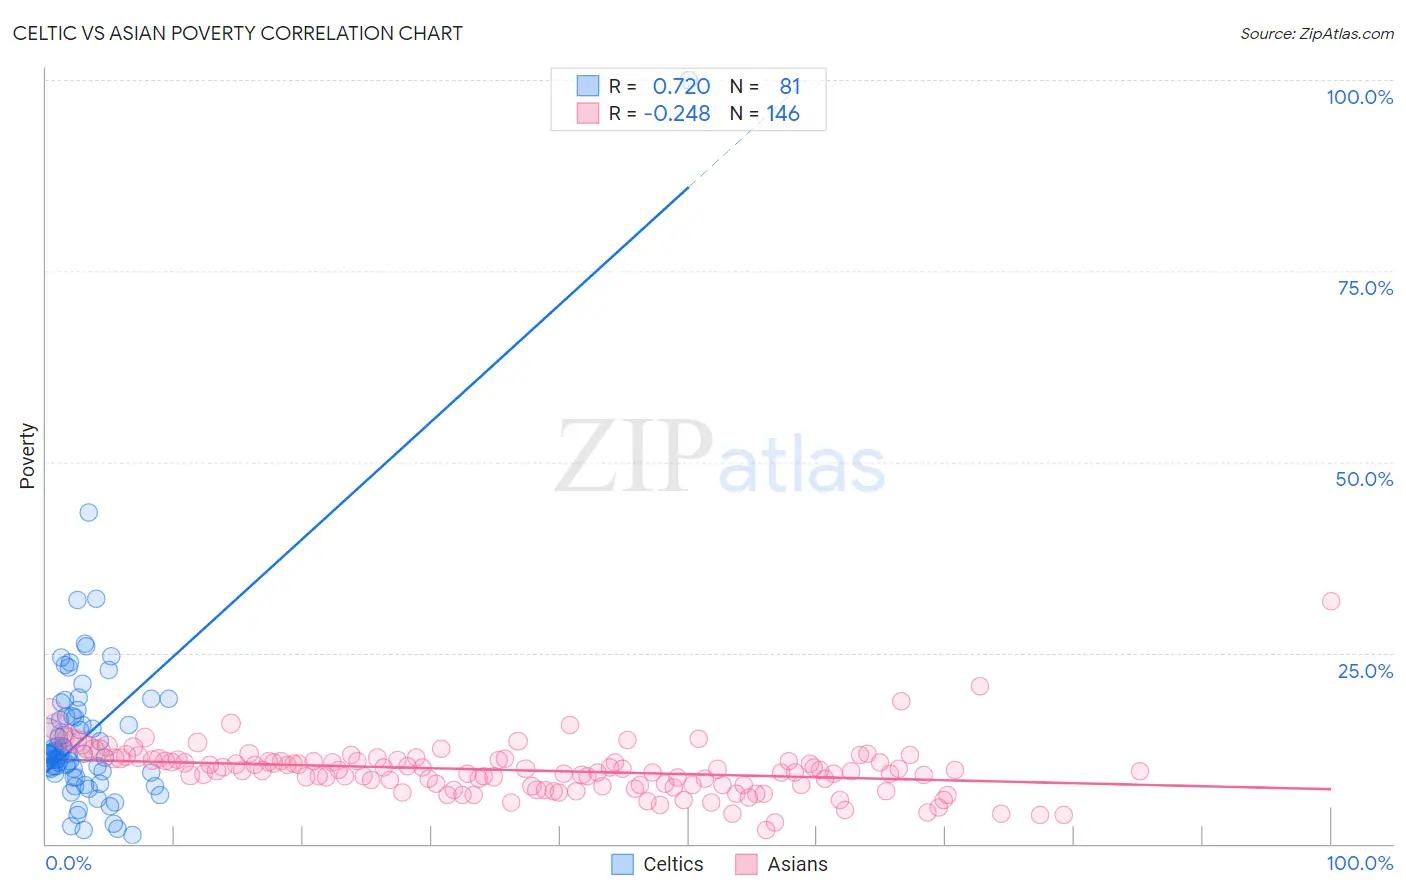
Celtic vs Asian Poverty Correlation Chart
The statistical analysis conducted on geographies consisting of 168,858,616 people shows a strong positive correlation between the proportion of Celtics and poverty level in the United States with a correlation coefficient (R) of 0.720 and weighted average of 12.3%. Similarly, the statistical analysis conducted on geographies consisting of 550,188,892 people shows a weak negative correlation between the proportion of Asians and poverty level in the United States with a correlation coefficient (R) of -0.248 and weighted average of 11.0%, a difference of 12.1%.
Poverty Correlation Summary
| Measurement | Celtic | Asian |
| Minimum | 1.1% | 1.8% |
| Maximum | 100.0% | 31.8% |
| Range | 98.9% | 29.9% |
| Mean | 14.3% | 9.6% |
| Median | 11.7% | 9.6% |
| Interquartile 25% (IQ1) | 9.3% | 7.6% |
| Interquartile 75% (IQ3) | 16.7% | 11.0% |
| Interquartile Range (IQR) | 7.4% | 3.4% |
| Standard Deviation (Sample) | 12.1% | 3.5% |
| Standard Deviation (Population) | 12.1% | 3.5% |
Similar Demographics by Poverty
Demographics Similar to Celtics by Poverty
In terms of poverty, the demographic groups most similar to Celtics are Lebanese (12.3%, a difference of 0.010%), Immigrants from Portugal (12.3%, a difference of 0.040%), Immigrants from Spain (12.3%, a difference of 0.11%), South American (12.3%, a difference of 0.14%), and Immigrants from Colombia (12.3%, a difference of 0.24%).
| Demographics | Rating | Rank | Poverty |
| Venezuelans | 56.9 /100 | #166 | Average 12.2% |
| Immigrants | Chile | 56.7 /100 | #167 | Average 12.2% |
| Immigrants | Venezuela | 56.5 /100 | #168 | Average 12.2% |
| Whites/Caucasians | 55.4 /100 | #169 | Average 12.3% |
| Immigrants | Oceania | 54.6 /100 | #170 | Average 12.3% |
| Immigrants | Spain | 51.3 /100 | #171 | Average 12.3% |
| Immigrants | Portugal | 50.5 /100 | #172 | Average 12.3% |
| Celtics | 50.1 /100 | #173 | Average 12.3% |
| Lebanese | 50.0 /100 | #174 | Average 12.3% |
| South Americans | 48.7 /100 | #175 | Average 12.3% |
| Immigrants | Colombia | 47.7 /100 | #176 | Average 12.3% |
| Immigrants | Syria | 47.5 /100 | #177 | Average 12.3% |
| Uruguayans | 44.7 /100 | #178 | Average 12.4% |
| Immigrants | Morocco | 44.0 /100 | #179 | Average 12.4% |
| Mongolians | 43.6 /100 | #180 | Average 12.4% |
Demographics Similar to Asians by Poverty
In terms of poverty, the demographic groups most similar to Asians are Immigrants from Japan (11.0%, a difference of 0.030%), Slovene (11.0%, a difference of 0.040%), Immigrants from Romania (11.0%, a difference of 0.080%), Immigrants from Czechoslovakia (11.0%, a difference of 0.10%), and Turkish (11.0%, a difference of 0.18%).
| Demographics | Rating | Rank | Poverty |
| Immigrants | Singapore | 99.2 /100 | #43 | Exceptional 10.9% |
| Immigrants | Moldova | 99.1 /100 | #44 | Exceptional 10.9% |
| Turks | 98.9 /100 | #45 | Exceptional 11.0% |
| Immigrants | Czechoslovakia | 98.9 /100 | #46 | Exceptional 11.0% |
| Immigrants | Romania | 98.9 /100 | #47 | Exceptional 11.0% |
| Slovenes | 98.9 /100 | #48 | Exceptional 11.0% |
| Immigrants | Japan | 98.9 /100 | #49 | Exceptional 11.0% |
| Asians | 98.9 /100 | #50 | Exceptional 11.0% |
| Immigrants | Croatia | 98.7 /100 | #51 | Exceptional 11.0% |
| Immigrants | Philippines | 98.7 /100 | #52 | Exceptional 11.0% |
| Immigrants | Austria | 98.6 /100 | #53 | Exceptional 11.1% |
| Immigrants | Bulgaria | 98.5 /100 | #54 | Exceptional 11.1% |
| Immigrants | Serbia | 98.5 /100 | #55 | Exceptional 11.1% |
| Estonians | 98.2 /100 | #56 | Exceptional 11.1% |
| Scandinavians | 98.2 /100 | #57 | Exceptional 11.1% |