Immigrants from Spain vs Navajo Female Poverty
COMPARE
Immigrants from Spain
Navajo
Female Poverty
Female Poverty Comparison
Immigrants from Spain
Navajo
13.4%
FEMALE POVERTY
49.9/ 100
METRIC RATING
176th/ 347
METRIC RANK
23.9%
FEMALE POVERTY
0.0/ 100
METRIC RATING
345th/ 347
METRIC RANK
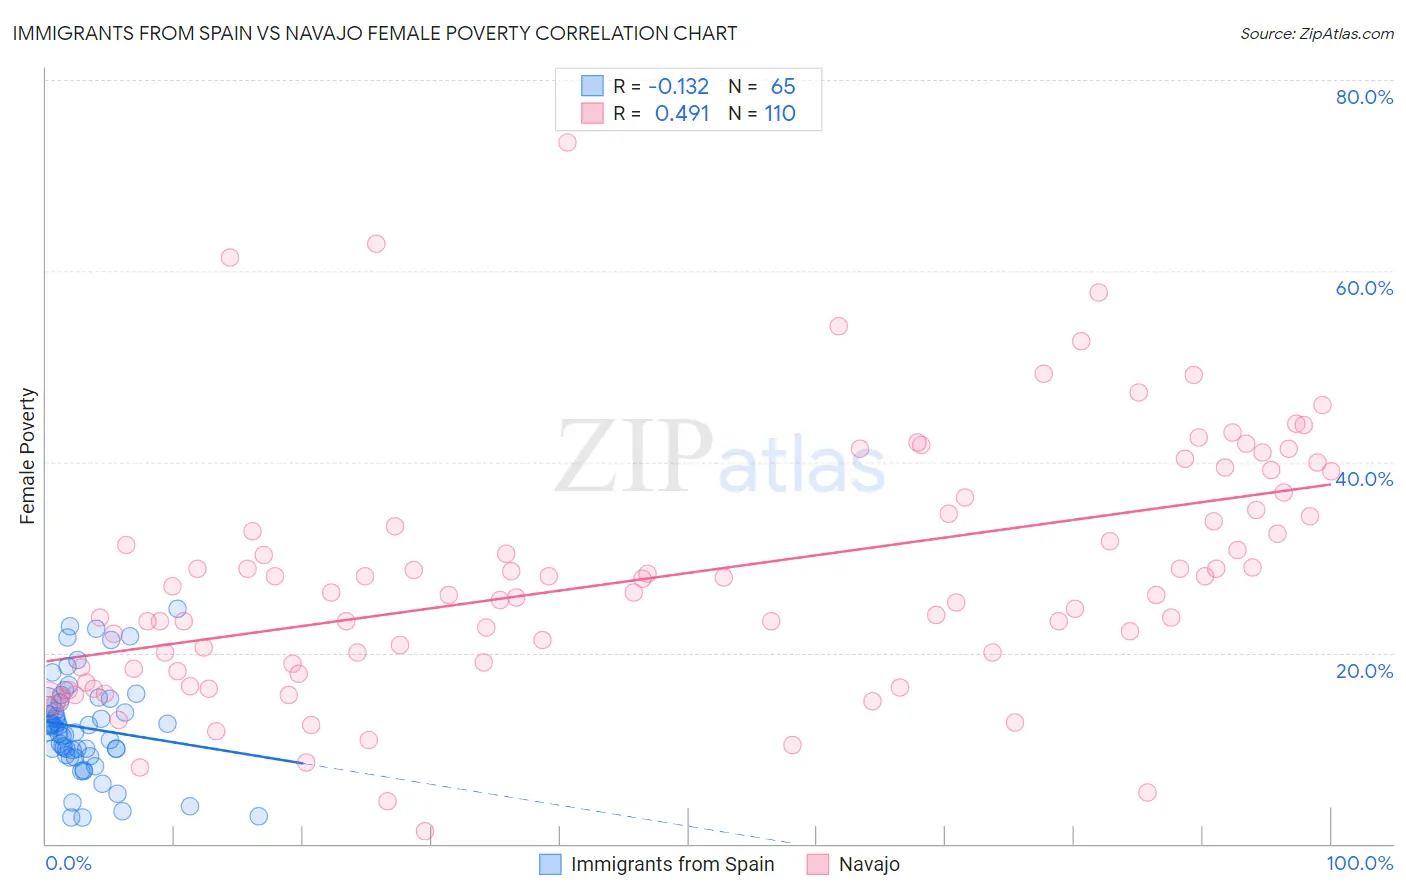
Immigrants from Spain vs Navajo Female Poverty Correlation Chart
The statistical analysis conducted on geographies consisting of 239,582,161 people shows a poor negative correlation between the proportion of Immigrants from Spain and poverty level among females in the United States with a correlation coefficient (R) of -0.132 and weighted average of 13.4%. Similarly, the statistical analysis conducted on geographies consisting of 224,729,638 people shows a moderate positive correlation between the proportion of Navajo and poverty level among females in the United States with a correlation coefficient (R) of 0.491 and weighted average of 23.9%, a difference of 77.7%.
Female Poverty Correlation Summary
| Measurement | Immigrants from Spain | Navajo |
| Minimum | 2.7% | 1.4% |
| Maximum | 24.6% | 73.5% |
| Range | 21.9% | 72.1% |
| Mean | 12.1% | 28.0% |
| Median | 12.2% | 26.3% |
| Interquartile 25% (IQ1) | 9.6% | 18.5% |
| Interquartile 75% (IQ3) | 14.8% | 34.9% |
| Interquartile Range (IQR) | 5.3% | 16.4% |
| Standard Deviation (Sample) | 5.0% | 13.1% |
| Standard Deviation (Population) | 4.9% | 13.0% |
Similar Demographics by Female Poverty
Demographics Similar to Immigrants from Spain by Female Poverty
In terms of female poverty, the demographic groups most similar to Immigrants from Spain are Celtic (13.4%, a difference of 0.0%), Immigrants from Iraq (13.4%, a difference of 0.010%), Immigrants from Morocco (13.4%, a difference of 0.040%), Israeli (13.5%, a difference of 0.080%), and Immigrants from Afghanistan (13.4%, a difference of 0.090%).
| Demographics | Rating | Rank | Female Poverty |
| Lebanese | 55.9 /100 | #169 | Average 13.4% |
| Colombians | 55.7 /100 | #170 | Average 13.4% |
| Whites/Caucasians | 54.6 /100 | #171 | Average 13.4% |
| Mongolians | 53.6 /100 | #172 | Average 13.4% |
| Immigrants | Afghanistan | 50.8 /100 | #173 | Average 13.4% |
| Immigrants | Iraq | 50.0 /100 | #174 | Average 13.4% |
| Celtics | 49.9 /100 | #175 | Average 13.4% |
| Immigrants | Spain | 49.9 /100 | #176 | Average 13.4% |
| Immigrants | Morocco | 49.4 /100 | #177 | Average 13.4% |
| Israelis | 49.1 /100 | #178 | Average 13.5% |
| Immigrants | Syria | 48.8 /100 | #179 | Average 13.5% |
| South Americans | 44.8 /100 | #180 | Average 13.5% |
| Venezuelans | 44.5 /100 | #181 | Average 13.5% |
| Immigrants | Colombia | 44.5 /100 | #182 | Average 13.5% |
| Kenyans | 43.8 /100 | #183 | Average 13.5% |
Demographics Similar to Navajo by Female Poverty
In terms of female poverty, the demographic groups most similar to Navajo are Pima (23.6%, a difference of 1.3%), Lumbee (23.5%, a difference of 1.6%), Immigrants from Yemen (22.8%, a difference of 4.6%), Puerto Rican (25.2%, a difference of 5.4%), and Crow (22.1%, a difference of 7.9%).
| Demographics | Rating | Rank | Female Poverty |
| Immigrants | Dominican Republic | 0.0 /100 | #333 | Tragic 19.3% |
| Houma | 0.0 /100 | #334 | Tragic 20.0% |
| Cheyenne | 0.0 /100 | #335 | Tragic 20.2% |
| Pueblo | 0.0 /100 | #336 | Tragic 20.7% |
| Yuman | 0.0 /100 | #337 | Tragic 20.8% |
| Sioux | 0.0 /100 | #338 | Tragic 20.9% |
| Hopi | 0.0 /100 | #339 | Tragic 21.0% |
| Yup'ik | 0.0 /100 | #340 | Tragic 21.5% |
| Crow | 0.0 /100 | #341 | Tragic 22.1% |
| Immigrants | Yemen | 0.0 /100 | #342 | Tragic 22.8% |
| Lumbee | 0.0 /100 | #343 | Tragic 23.5% |
| Pima | 0.0 /100 | #344 | Tragic 23.6% |
| Navajo | 0.0 /100 | #345 | Tragic 23.9% |
| Puerto Ricans | 0.0 /100 | #346 | Tragic 25.2% |
| Tohono O'odham | 0.0 /100 | #347 | Tragic 25.9% |