Immigrants from Spain vs Navajo College, Under 1 year
COMPARE
Immigrants from Spain
Navajo
College, Under 1 year
College, Under 1 year Comparison
Immigrants from Spain
Navajo
68.4%
COLLEGE, UNDER 1 YEAR
98.5/ 100
METRIC RATING
80th/ 347
METRIC RANK
56.3%
COLLEGE, UNDER 1 YEAR
0.0/ 100
METRIC RATING
326th/ 347
METRIC RANK
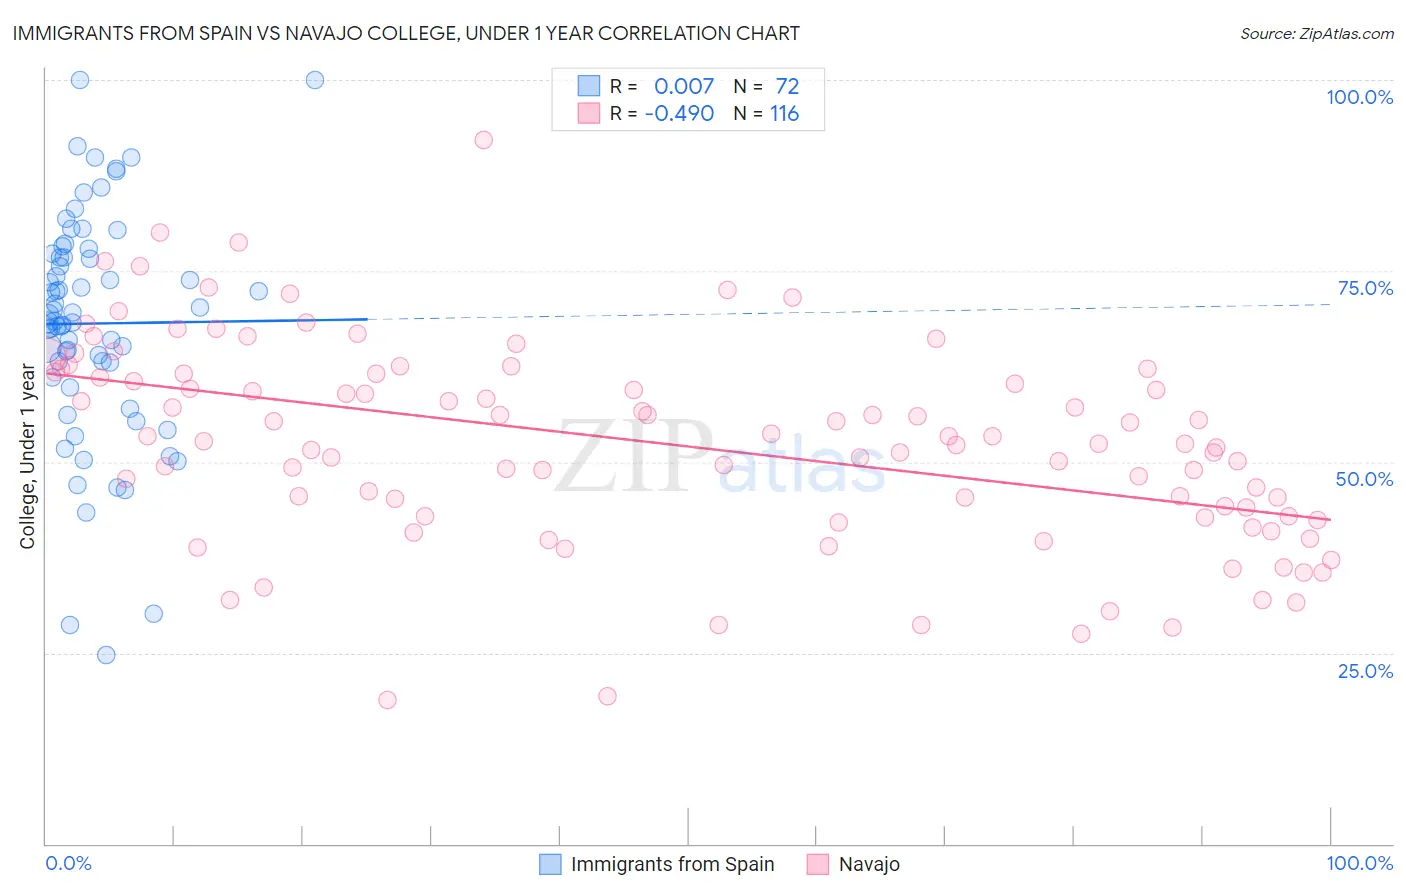
Immigrants from Spain vs Navajo College, Under 1 year Correlation Chart
The statistical analysis conducted on geographies consisting of 239,683,397 people shows no correlation between the proportion of Immigrants from Spain and percentage of population with at least college, under 1 year education in the United States with a correlation coefficient (R) of 0.007 and weighted average of 68.4%. Similarly, the statistical analysis conducted on geographies consisting of 224,872,431 people shows a moderate negative correlation between the proportion of Navajo and percentage of population with at least college, under 1 year education in the United States with a correlation coefficient (R) of -0.490 and weighted average of 56.3%, a difference of 21.6%.
College, Under 1 year Correlation Summary
| Measurement | Immigrants from Spain | Navajo |
| Minimum | 24.8% | 18.9% |
| Maximum | 100.0% | 92.2% |
| Range | 75.2% | 73.3% |
| Mean | 68.1% | 52.4% |
| Median | 68.9% | 52.5% |
| Interquartile 25% (IQ1) | 62.0% | 42.9% |
| Interquartile 75% (IQ3) | 77.0% | 61.6% |
| Interquartile Range (IQR) | 15.0% | 18.7% |
| Standard Deviation (Sample) | 15.0% | 13.3% |
| Standard Deviation (Population) | 14.9% | 13.2% |
Similar Demographics by College, Under 1 year
Demographics Similar to Immigrants from Spain by College, Under 1 year
In terms of college, under 1 year, the demographic groups most similar to Immigrants from Spain are Greek (68.5%, a difference of 0.030%), Danish (68.5%, a difference of 0.040%), Immigrants from Greece (68.4%, a difference of 0.040%), British (68.5%, a difference of 0.050%), and Immigrants from Western Europe (68.5%, a difference of 0.090%).
| Demographics | Rating | Rank | College, Under 1 year |
| Immigrants | England | 99.0 /100 | #73 | Exceptional 68.7% |
| Swedes | 98.9 /100 | #74 | Exceptional 68.7% |
| Immigrants | Western Europe | 98.6 /100 | #75 | Exceptional 68.5% |
| Laotians | 98.6 /100 | #76 | Exceptional 68.5% |
| British | 98.6 /100 | #77 | Exceptional 68.5% |
| Danes | 98.6 /100 | #78 | Exceptional 68.5% |
| Greeks | 98.6 /100 | #79 | Exceptional 68.5% |
| Immigrants | Spain | 98.5 /100 | #80 | Exceptional 68.4% |
| Immigrants | Greece | 98.5 /100 | #81 | Exceptional 68.4% |
| Norwegians | 98.4 /100 | #82 | Exceptional 68.4% |
| Argentineans | 98.4 /100 | #83 | Exceptional 68.4% |
| Immigrants | Hungary | 98.3 /100 | #84 | Exceptional 68.3% |
| Egyptians | 98.3 /100 | #85 | Exceptional 68.3% |
| Immigrants | Lebanon | 98.3 /100 | #86 | Exceptional 68.3% |
| Chinese | 98.3 /100 | #87 | Exceptional 68.3% |
Demographics Similar to Navajo by College, Under 1 year
In terms of college, under 1 year, the demographic groups most similar to Navajo are Immigrants from Guatemala (56.2%, a difference of 0.090%), Immigrants from Latin America (56.3%, a difference of 0.15%), Immigrants from El Salvador (56.4%, a difference of 0.25%), Immigrants from Honduras (56.5%, a difference of 0.38%), and Cape Verdean (56.0%, a difference of 0.38%).
| Demographics | Rating | Rank | College, Under 1 year |
| Puerto Ricans | 0.0 /100 | #319 | Tragic 56.8% |
| Guatemalans | 0.0 /100 | #320 | Tragic 56.8% |
| Natives/Alaskans | 0.0 /100 | #321 | Tragic 56.6% |
| Immigrants | Caribbean | 0.0 /100 | #322 | Tragic 56.6% |
| Immigrants | Honduras | 0.0 /100 | #323 | Tragic 56.5% |
| Immigrants | El Salvador | 0.0 /100 | #324 | Tragic 56.4% |
| Immigrants | Latin America | 0.0 /100 | #325 | Tragic 56.3% |
| Navajo | 0.0 /100 | #326 | Tragic 56.3% |
| Immigrants | Guatemala | 0.0 /100 | #327 | Tragic 56.2% |
| Cape Verdeans | 0.0 /100 | #328 | Tragic 56.0% |
| Immigrants | Cuba | 0.0 /100 | #329 | Tragic 55.7% |
| Mexicans | 0.0 /100 | #330 | Tragic 55.6% |
| Dominicans | 0.0 /100 | #331 | Tragic 55.5% |
| Immigrants | Yemen | 0.0 /100 | #332 | Tragic 55.3% |
| Yuman | 0.0 /100 | #333 | Tragic 55.1% |