Immigrants from Spain vs Pakistani Female Poverty
COMPARE
Immigrants from Spain
Pakistani
Female Poverty
Female Poverty Comparison
Immigrants from Spain
Pakistanis
13.4%
FEMALE POVERTY
49.9/ 100
METRIC RATING
176th/ 347
METRIC RANK
12.9%
FEMALE POVERTY
83.0/ 100
METRIC RATING
140th/ 347
METRIC RANK
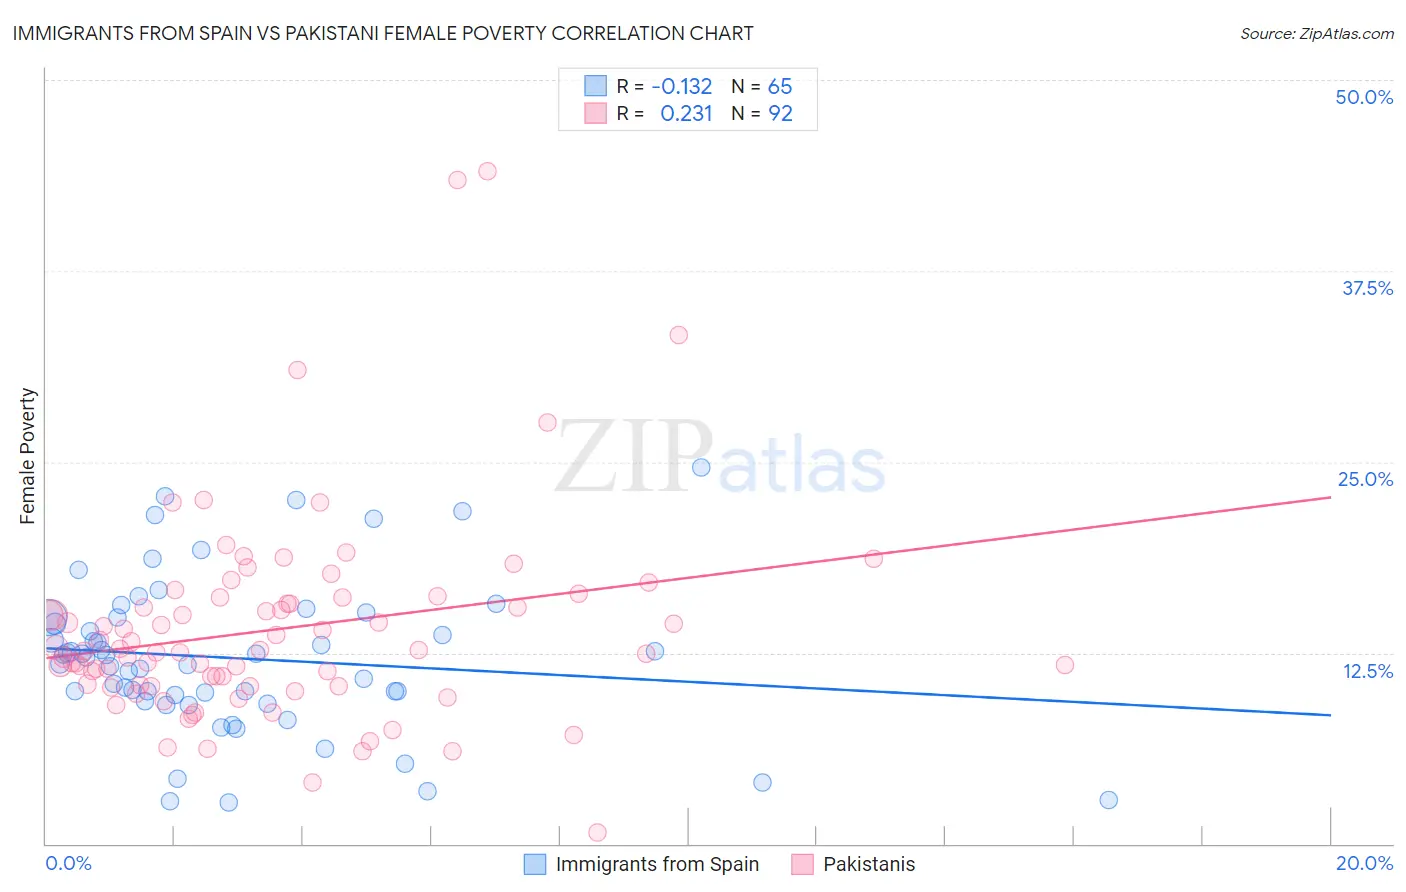
Immigrants from Spain vs Pakistani Female Poverty Correlation Chart
The statistical analysis conducted on geographies consisting of 239,582,161 people shows a poor negative correlation between the proportion of Immigrants from Spain and poverty level among females in the United States with a correlation coefficient (R) of -0.132 and weighted average of 13.4%. Similarly, the statistical analysis conducted on geographies consisting of 335,177,271 people shows a weak positive correlation between the proportion of Pakistanis and poverty level among females in the United States with a correlation coefficient (R) of 0.231 and weighted average of 12.9%, a difference of 4.0%.
Female Poverty Correlation Summary
| Measurement | Immigrants from Spain | Pakistani |
| Minimum | 2.7% | 0.74% |
| Maximum | 24.6% | 44.1% |
| Range | 21.9% | 43.3% |
| Mean | 12.1% | 14.0% |
| Median | 12.2% | 12.7% |
| Interquartile 25% (IQ1) | 9.6% | 10.3% |
| Interquartile 75% (IQ3) | 14.8% | 15.9% |
| Interquartile Range (IQR) | 5.3% | 5.6% |
| Standard Deviation (Sample) | 5.0% | 6.8% |
| Standard Deviation (Population) | 4.9% | 6.7% |
Similar Demographics by Female Poverty
Demographics Similar to Immigrants from Spain by Female Poverty
In terms of female poverty, the demographic groups most similar to Immigrants from Spain are Celtic (13.4%, a difference of 0.0%), Immigrants from Iraq (13.4%, a difference of 0.010%), Immigrants from Morocco (13.4%, a difference of 0.040%), Israeli (13.5%, a difference of 0.080%), and Immigrants from Afghanistan (13.4%, a difference of 0.090%).
| Demographics | Rating | Rank | Female Poverty |
| Lebanese | 55.9 /100 | #169 | Average 13.4% |
| Colombians | 55.7 /100 | #170 | Average 13.4% |
| Whites/Caucasians | 54.6 /100 | #171 | Average 13.4% |
| Mongolians | 53.6 /100 | #172 | Average 13.4% |
| Immigrants | Afghanistan | 50.8 /100 | #173 | Average 13.4% |
| Immigrants | Iraq | 50.0 /100 | #174 | Average 13.4% |
| Celtics | 49.9 /100 | #175 | Average 13.4% |
| Immigrants | Spain | 49.9 /100 | #176 | Average 13.4% |
| Immigrants | Morocco | 49.4 /100 | #177 | Average 13.4% |
| Israelis | 49.1 /100 | #178 | Average 13.5% |
| Immigrants | Syria | 48.8 /100 | #179 | Average 13.5% |
| South Americans | 44.8 /100 | #180 | Average 13.5% |
| Venezuelans | 44.5 /100 | #181 | Average 13.5% |
| Immigrants | Colombia | 44.5 /100 | #182 | Average 13.5% |
| Kenyans | 43.8 /100 | #183 | Average 13.5% |
Demographics Similar to Pakistanis by Female Poverty
In terms of female poverty, the demographic groups most similar to Pakistanis are Basque (12.9%, a difference of 0.010%), Immigrants from France (12.9%, a difference of 0.10%), Chilean (12.9%, a difference of 0.32%), Icelander (13.0%, a difference of 0.32%), and Peruvian (12.9%, a difference of 0.41%).
| Demographics | Rating | Rank | Female Poverty |
| Immigrants | Western Europe | 86.6 /100 | #133 | Excellent 12.8% |
| Immigrants | Switzerland | 85.8 /100 | #134 | Excellent 12.9% |
| French | 85.6 /100 | #135 | Excellent 12.9% |
| Peruvians | 85.2 /100 | #136 | Excellent 12.9% |
| Chileans | 84.7 /100 | #137 | Excellent 12.9% |
| Immigrants | France | 83.6 /100 | #138 | Excellent 12.9% |
| Basques | 83.1 /100 | #139 | Excellent 12.9% |
| Pakistanis | 83.0 /100 | #140 | Excellent 12.9% |
| Icelanders | 81.1 /100 | #141 | Excellent 13.0% |
| Brazilians | 80.5 /100 | #142 | Excellent 13.0% |
| Immigrants | Malaysia | 80.4 /100 | #143 | Excellent 13.0% |
| Afghans | 79.8 /100 | #144 | Good 13.0% |
| Syrians | 79.6 /100 | #145 | Good 13.0% |
| Immigrants | Peru | 79.1 /100 | #146 | Good 13.0% |
| Immigrants | Kazakhstan | 78.6 /100 | #147 | Good 13.0% |