Immigrants from Spain vs Immigrants from Albania Female Poverty
COMPARE
Immigrants from Spain
Immigrants from Albania
Female Poverty
Female Poverty Comparison
Immigrants from Spain
Immigrants from Albania
13.4%
FEMALE POVERTY
49.9/ 100
METRIC RATING
176th/ 347
METRIC RANK
13.3%
FEMALE POVERTY
62.4/ 100
METRIC RATING
163rd/ 347
METRIC RANK
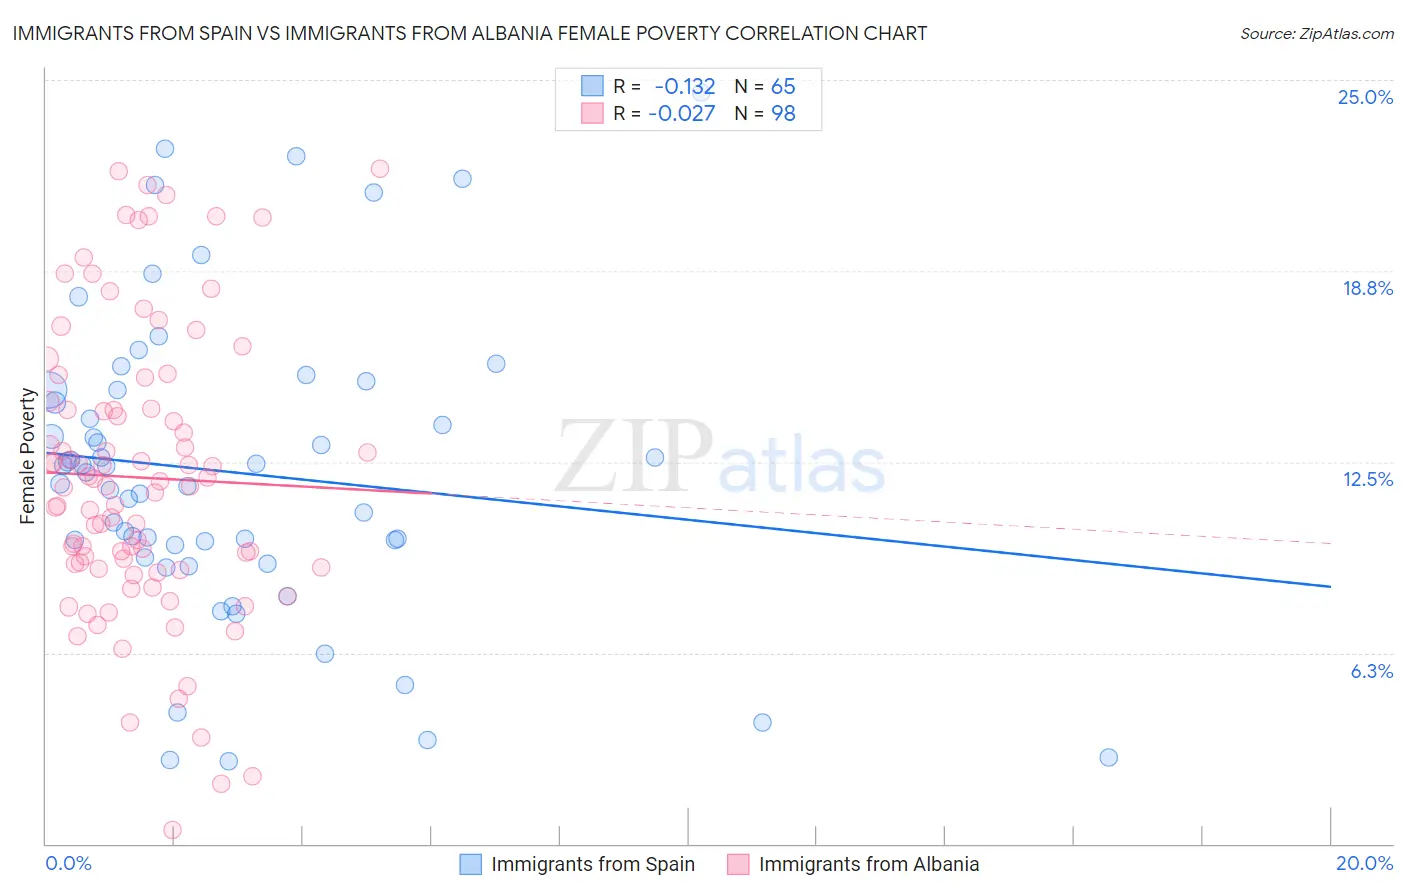
Immigrants from Spain vs Immigrants from Albania Female Poverty Correlation Chart
The statistical analysis conducted on geographies consisting of 239,582,161 people shows a poor negative correlation between the proportion of Immigrants from Spain and poverty level among females in the United States with a correlation coefficient (R) of -0.132 and weighted average of 13.4%. Similarly, the statistical analysis conducted on geographies consisting of 119,347,063 people shows no correlation between the proportion of Immigrants from Albania and poverty level among females in the United States with a correlation coefficient (R) of -0.027 and weighted average of 13.3%, a difference of 1.2%.
Female Poverty Correlation Summary
| Measurement | Immigrants from Spain | Immigrants from Albania |
| Minimum | 2.7% | 0.46% |
| Maximum | 24.6% | 22.1% |
| Range | 21.9% | 21.6% |
| Mean | 12.1% | 12.0% |
| Median | 12.2% | 11.7% |
| Interquartile 25% (IQ1) | 9.6% | 9.0% |
| Interquartile 75% (IQ3) | 14.8% | 14.3% |
| Interquartile Range (IQR) | 5.3% | 5.2% |
| Standard Deviation (Sample) | 5.0% | 4.7% |
| Standard Deviation (Population) | 4.9% | 4.7% |
Demographics Similar to Immigrants from Spain and Immigrants from Albania by Female Poverty
In terms of female poverty, the demographic groups most similar to Immigrants from Spain are Celtic (13.4%, a difference of 0.0%), Immigrants from Iraq (13.4%, a difference of 0.010%), Immigrants from Morocco (13.4%, a difference of 0.040%), Israeli (13.5%, a difference of 0.080%), and Immigrants from Afghanistan (13.4%, a difference of 0.090%). Similarly, the demographic groups most similar to Immigrants from Albania are Guamanian/Chamorro (13.3%, a difference of 0.0%), Immigrants from Ethiopia (13.3%, a difference of 0.010%), Ethiopian (13.3%, a difference of 0.010%), Scotch-Irish (13.3%, a difference of 0.030%), and Immigrants from Nepal (13.3%, a difference of 0.040%).
| Demographics | Rating | Rank | Female Poverty |
| Costa Ricans | 63.6 /100 | #159 | Good 13.3% |
| Immigrants | Nepal | 62.7 /100 | #160 | Good 13.3% |
| Immigrants | Ethiopia | 62.5 /100 | #161 | Good 13.3% |
| Guamanians/Chamorros | 62.4 /100 | #162 | Good 13.3% |
| Immigrants | Albania | 62.4 /100 | #163 | Good 13.3% |
| Ethiopians | 62.3 /100 | #164 | Good 13.3% |
| Scotch-Irish | 62.1 /100 | #165 | Good 13.3% |
| Immigrants | Oceania | 59.7 /100 | #166 | Average 13.3% |
| Immigrants | Chile | 57.4 /100 | #167 | Average 13.3% |
| Aleuts | 56.7 /100 | #168 | Average 13.4% |
| Lebanese | 55.9 /100 | #169 | Average 13.4% |
| Colombians | 55.7 /100 | #170 | Average 13.4% |
| Whites/Caucasians | 54.6 /100 | #171 | Average 13.4% |
| Mongolians | 53.6 /100 | #172 | Average 13.4% |
| Immigrants | Afghanistan | 50.8 /100 | #173 | Average 13.4% |
| Immigrants | Iraq | 50.0 /100 | #174 | Average 13.4% |
| Celtics | 49.9 /100 | #175 | Average 13.4% |
| Immigrants | Spain | 49.9 /100 | #176 | Average 13.4% |
| Immigrants | Morocco | 49.4 /100 | #177 | Average 13.4% |
| Israelis | 49.1 /100 | #178 | Average 13.5% |
| Immigrants | Syria | 48.8 /100 | #179 | Average 13.5% |