Puget Sound Salish vs Navajo Female Poverty
COMPARE
Puget Sound Salish
Navajo
Female Poverty
Female Poverty Comparison
Puget Sound Salish
Navajo
12.7%
FEMALE POVERTY
91.5/ 100
METRIC RATING
115th/ 347
METRIC RANK
23.9%
FEMALE POVERTY
0.0/ 100
METRIC RATING
345th/ 347
METRIC RANK
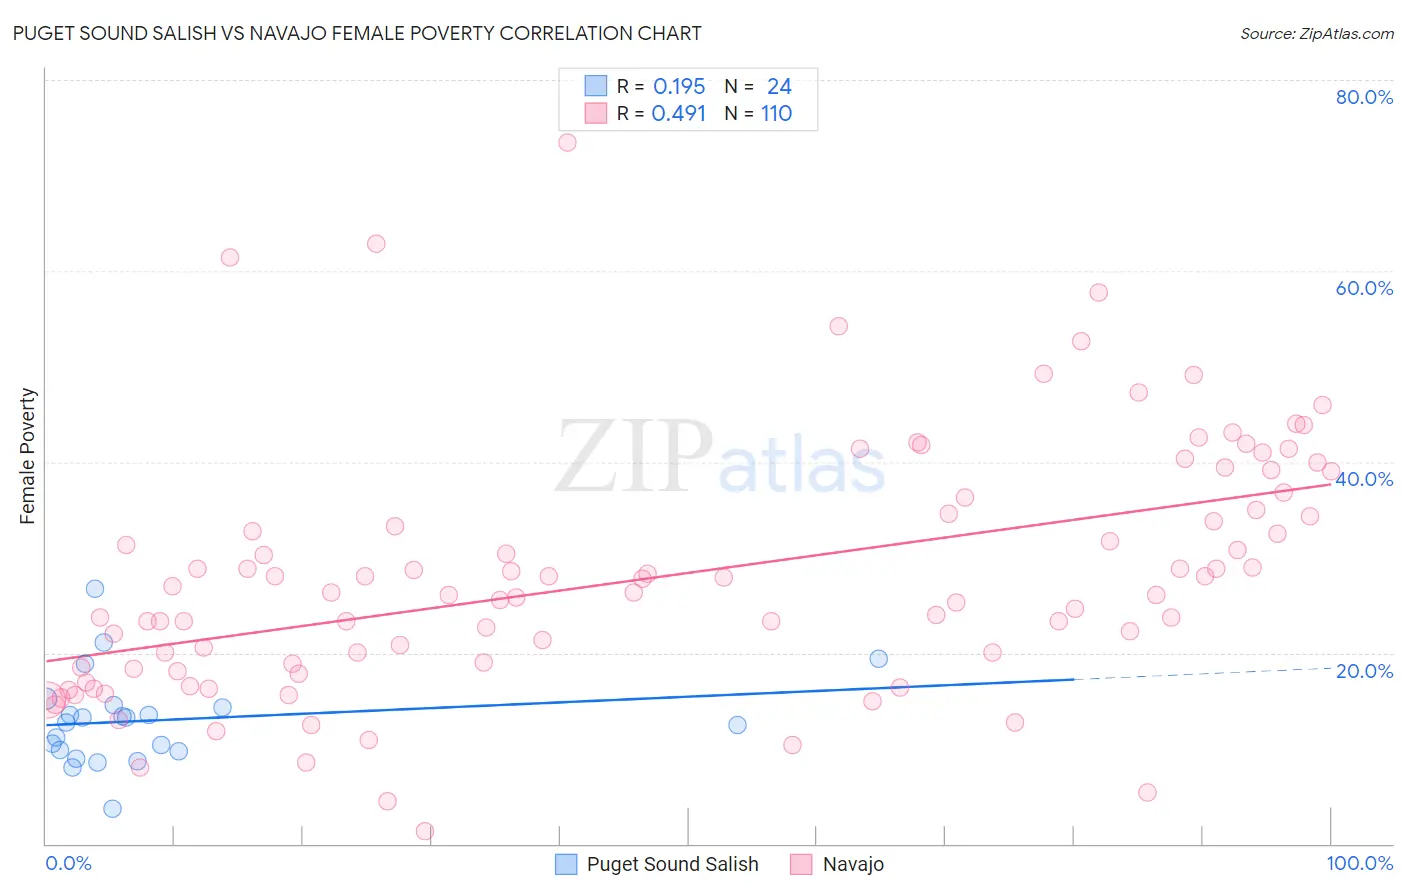
Puget Sound Salish vs Navajo Female Poverty Correlation Chart
The statistical analysis conducted on geographies consisting of 46,146,424 people shows a poor positive correlation between the proportion of Puget Sound Salish and poverty level among females in the United States with a correlation coefficient (R) of 0.195 and weighted average of 12.7%. Similarly, the statistical analysis conducted on geographies consisting of 224,729,638 people shows a moderate positive correlation between the proportion of Navajo and poverty level among females in the United States with a correlation coefficient (R) of 0.491 and weighted average of 23.9%, a difference of 88.6%.
Female Poverty Correlation Summary
| Measurement | Puget Sound Salish | Navajo |
| Minimum | 3.6% | 1.4% |
| Maximum | 26.7% | 73.5% |
| Range | 23.1% | 72.1% |
| Mean | 13.0% | 28.0% |
| Median | 13.0% | 26.3% |
| Interquartile 25% (IQ1) | 9.8% | 18.5% |
| Interquartile 75% (IQ3) | 14.4% | 34.9% |
| Interquartile Range (IQR) | 4.7% | 16.4% |
| Standard Deviation (Sample) | 4.9% | 13.1% |
| Standard Deviation (Population) | 4.8% | 13.0% |
Similar Demographics by Female Poverty
Demographics Similar to Puget Sound Salish by Female Poverty
In terms of female poverty, the demographic groups most similar to Puget Sound Salish are Welsh (12.7%, a difference of 0.020%), Immigrants from Russia (12.7%, a difference of 0.12%), Canadian (12.7%, a difference of 0.14%), Immigrants from Israel (12.6%, a difference of 0.17%), and Immigrants from Southern Europe (12.7%, a difference of 0.20%).
| Demographics | Rating | Rank | Female Poverty |
| Portuguese | 93.1 /100 | #108 | Exceptional 12.6% |
| Immigrants | Zimbabwe | 93.1 /100 | #109 | Exceptional 12.6% |
| Paraguayans | 93.0 /100 | #110 | Exceptional 12.6% |
| Soviet Union | 92.4 /100 | #111 | Exceptional 12.6% |
| Immigrants | Israel | 92.0 /100 | #112 | Exceptional 12.6% |
| Canadians | 92.0 /100 | #113 | Exceptional 12.7% |
| Welsh | 91.6 /100 | #114 | Exceptional 12.7% |
| Puget Sound Salish | 91.5 /100 | #115 | Exceptional 12.7% |
| Immigrants | Russia | 91.2 /100 | #116 | Exceptional 12.7% |
| Immigrants | Southern Europe | 90.9 /100 | #117 | Exceptional 12.7% |
| Sri Lankans | 90.9 /100 | #118 | Exceptional 12.7% |
| Albanians | 90.8 /100 | #119 | Exceptional 12.7% |
| New Zealanders | 90.6 /100 | #120 | Exceptional 12.7% |
| Immigrants | Hungary | 90.3 /100 | #121 | Exceptional 12.7% |
| French Canadians | 90.2 /100 | #122 | Exceptional 12.7% |
Demographics Similar to Navajo by Female Poverty
In terms of female poverty, the demographic groups most similar to Navajo are Pima (23.6%, a difference of 1.3%), Lumbee (23.5%, a difference of 1.6%), Immigrants from Yemen (22.8%, a difference of 4.6%), Puerto Rican (25.2%, a difference of 5.4%), and Crow (22.1%, a difference of 7.9%).
| Demographics | Rating | Rank | Female Poverty |
| Immigrants | Dominican Republic | 0.0 /100 | #333 | Tragic 19.3% |
| Houma | 0.0 /100 | #334 | Tragic 20.0% |
| Cheyenne | 0.0 /100 | #335 | Tragic 20.2% |
| Pueblo | 0.0 /100 | #336 | Tragic 20.7% |
| Yuman | 0.0 /100 | #337 | Tragic 20.8% |
| Sioux | 0.0 /100 | #338 | Tragic 20.9% |
| Hopi | 0.0 /100 | #339 | Tragic 21.0% |
| Yup'ik | 0.0 /100 | #340 | Tragic 21.5% |
| Crow | 0.0 /100 | #341 | Tragic 22.1% |
| Immigrants | Yemen | 0.0 /100 | #342 | Tragic 22.8% |
| Lumbee | 0.0 /100 | #343 | Tragic 23.5% |
| Pima | 0.0 /100 | #344 | Tragic 23.6% |
| Navajo | 0.0 /100 | #345 | Tragic 23.9% |
| Puerto Ricans | 0.0 /100 | #346 | Tragic 25.2% |
| Tohono O'odham | 0.0 /100 | #347 | Tragic 25.9% |