Immigrants from Israel vs Scandinavian Single Female Poverty
COMPARE
Immigrants from Israel
Scandinavian
Single Female Poverty
Single Female Poverty Comparison
Immigrants from Israel
Scandinavians
18.3%
SINGLE FEMALE POVERTY
100.0/ 100
METRIC RATING
26th/ 347
METRIC RANK
21.1%
SINGLE FEMALE POVERTY
45.2/ 100
METRIC RATING
177th/ 347
METRIC RANK
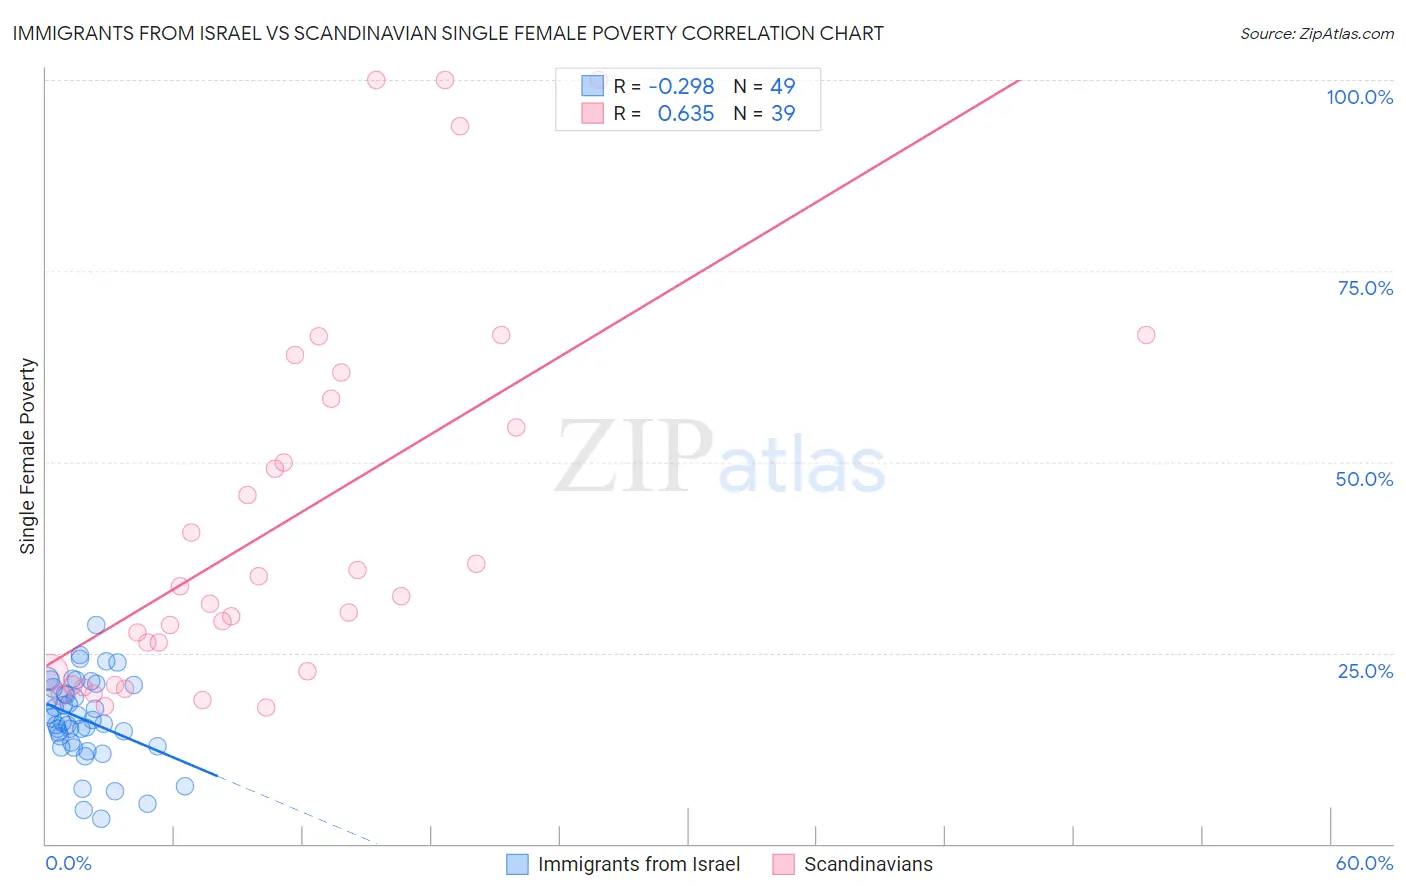
Immigrants from Israel vs Scandinavian Single Female Poverty Correlation Chart
The statistical analysis conducted on geographies consisting of 207,619,232 people shows a weak negative correlation between the proportion of Immigrants from Israel and poverty level among single females in the United States with a correlation coefficient (R) of -0.298 and weighted average of 18.3%. Similarly, the statistical analysis conducted on geographies consisting of 461,288,786 people shows a significant positive correlation between the proportion of Scandinavians and poverty level among single females in the United States with a correlation coefficient (R) of 0.635 and weighted average of 21.1%, a difference of 14.9%.
Single Female Poverty Correlation Summary
| Measurement | Immigrants from Israel | Scandinavian |
| Minimum | 3.3% | 17.8% |
| Maximum | 28.6% | 100.0% |
| Range | 25.2% | 82.2% |
| Mean | 16.3% | 42.1% |
| Median | 16.3% | 32.4% |
| Interquartile 25% (IQ1) | 13.0% | 22.3% |
| Interquartile 75% (IQ3) | 20.6% | 58.3% |
| Interquartile Range (IQR) | 7.6% | 36.0% |
| Standard Deviation (Sample) | 5.5% | 24.6% |
| Standard Deviation (Population) | 5.4% | 24.3% |
Similar Demographics by Single Female Poverty
Demographics Similar to Immigrants from Israel by Single Female Poverty
In terms of single female poverty, the demographic groups most similar to Immigrants from Israel are Immigrants from Singapore (18.3%, a difference of 0.020%), Armenian (18.3%, a difference of 0.12%), Immigrants from Pakistan (18.4%, a difference of 0.33%), Burmese (18.3%, a difference of 0.35%), and Asian (18.3%, a difference of 0.35%).
| Demographics | Rating | Rank | Single Female Poverty |
| Immigrants | China | 100.0 /100 | #19 | Exceptional 18.1% |
| Immigrants | Greece | 100.0 /100 | #20 | Exceptional 18.3% |
| Maltese | 100.0 /100 | #21 | Exceptional 18.3% |
| Burmese | 100.0 /100 | #22 | Exceptional 18.3% |
| Asians | 100.0 /100 | #23 | Exceptional 18.3% |
| Armenians | 100.0 /100 | #24 | Exceptional 18.3% |
| Immigrants | Singapore | 100.0 /100 | #25 | Exceptional 18.3% |
| Immigrants | Israel | 100.0 /100 | #26 | Exceptional 18.3% |
| Immigrants | Pakistan | 100.0 /100 | #27 | Exceptional 18.4% |
| Immigrants | Moldova | 100.0 /100 | #28 | Exceptional 18.5% |
| Immigrants | Poland | 100.0 /100 | #29 | Exceptional 18.5% |
| Immigrants | North Macedonia | 99.9 /100 | #30 | Exceptional 18.5% |
| Immigrants | Asia | 99.9 /100 | #31 | Exceptional 18.6% |
| Immigrants | Sri Lanka | 99.9 /100 | #32 | Exceptional 18.6% |
| Immigrants | Philippines | 99.9 /100 | #33 | Exceptional 18.6% |
Demographics Similar to Scandinavians by Single Female Poverty
In terms of single female poverty, the demographic groups most similar to Scandinavians are Canadian (21.1%, a difference of 0.010%), Immigrants from Bosnia and Herzegovina (21.1%, a difference of 0.020%), Czech (21.0%, a difference of 0.10%), British (21.1%, a difference of 0.14%), and Spanish American Indian (21.1%, a difference of 0.17%).
| Demographics | Rating | Rank | Single Female Poverty |
| New Zealanders | 53.2 /100 | #170 | Average 21.0% |
| Moroccans | 52.8 /100 | #171 | Average 21.0% |
| Guyanese | 52.0 /100 | #172 | Average 21.0% |
| Immigrants | Guyana | 50.6 /100 | #173 | Average 21.0% |
| Cubans | 50.0 /100 | #174 | Average 21.0% |
| Czechs | 46.8 /100 | #175 | Average 21.0% |
| Canadians | 45.4 /100 | #176 | Average 21.1% |
| Scandinavians | 45.2 /100 | #177 | Average 21.1% |
| Immigrants | Bosnia and Herzegovina | 44.9 /100 | #178 | Average 21.1% |
| British | 42.9 /100 | #179 | Average 21.1% |
| Spanish American Indians | 42.5 /100 | #180 | Average 21.1% |
| Europeans | 42.3 /100 | #181 | Average 21.1% |
| Slavs | 40.5 /100 | #182 | Average 21.1% |
| Slovaks | 39.7 /100 | #183 | Fair 21.1% |
| Hungarians | 39.6 /100 | #184 | Fair 21.1% |