German vs Scandinavian Single Female Poverty
COMPARE
German
Scandinavian
Single Female Poverty
Single Female Poverty Comparison
Germans
Scandinavians
21.8%
SINGLE FEMALE POVERTY
8.3/ 100
METRIC RATING
220th/ 347
METRIC RANK
21.1%
SINGLE FEMALE POVERTY
45.2/ 100
METRIC RATING
177th/ 347
METRIC RANK
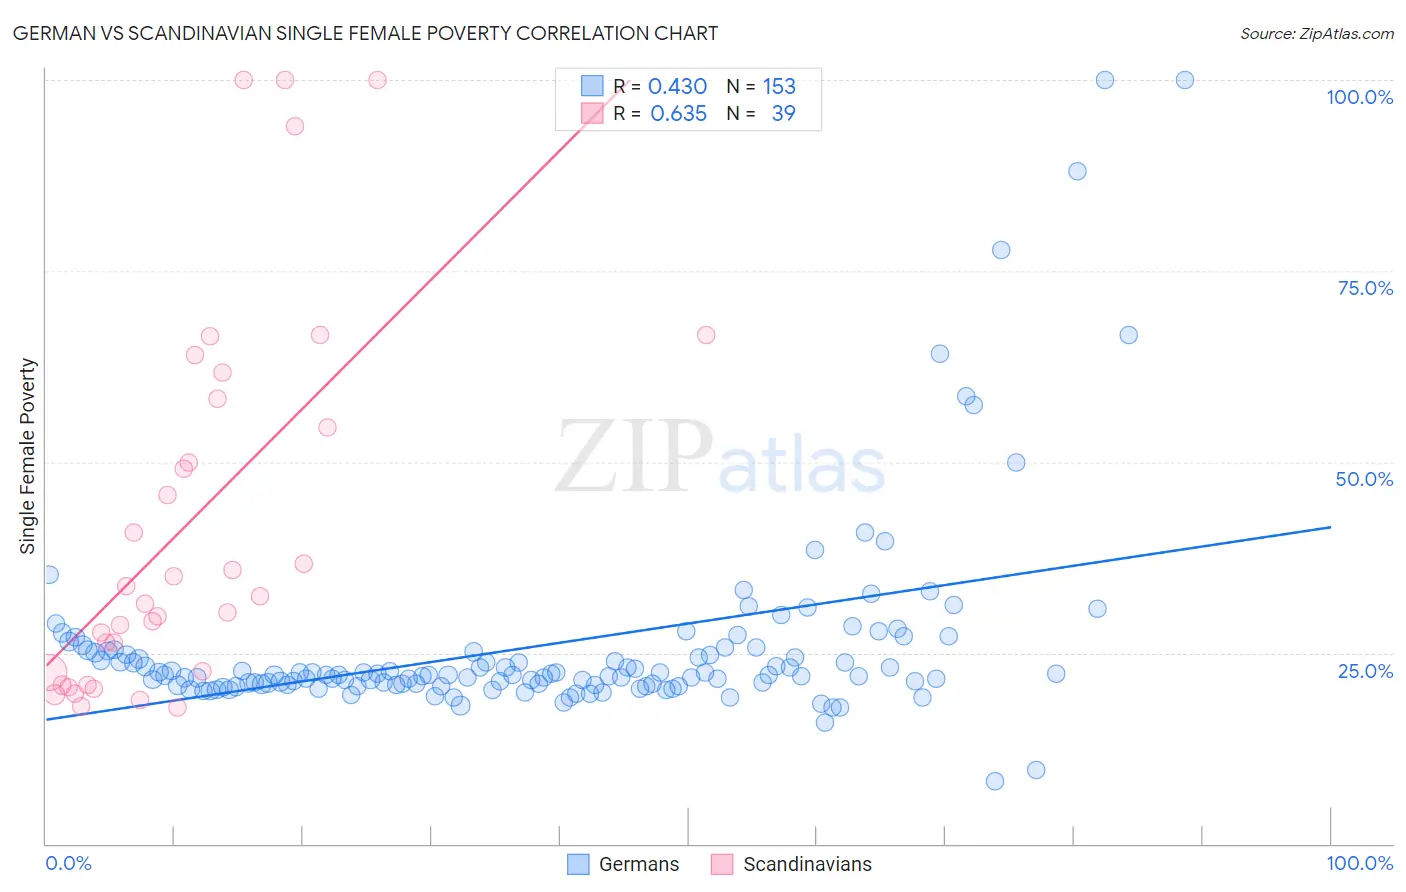
German vs Scandinavian Single Female Poverty Correlation Chart
The statistical analysis conducted on geographies consisting of 558,181,228 people shows a moderate positive correlation between the proportion of Germans and poverty level among single females in the United States with a correlation coefficient (R) of 0.430 and weighted average of 21.8%. Similarly, the statistical analysis conducted on geographies consisting of 461,288,786 people shows a significant positive correlation between the proportion of Scandinavians and poverty level among single females in the United States with a correlation coefficient (R) of 0.635 and weighted average of 21.1%, a difference of 3.4%.
Single Female Poverty Correlation Summary
| Measurement | German | Scandinavian |
| Minimum | 8.2% | 17.8% |
| Maximum | 100.0% | 100.0% |
| Range | 91.8% | 82.2% |
| Mean | 26.0% | 42.1% |
| Median | 22.1% | 32.4% |
| Interquartile 25% (IQ1) | 20.8% | 22.3% |
| Interquartile 75% (IQ3) | 25.2% | 58.3% |
| Interquartile Range (IQR) | 4.3% | 36.0% |
| Standard Deviation (Sample) | 13.4% | 24.6% |
| Standard Deviation (Population) | 13.4% | 24.3% |
Similar Demographics by Single Female Poverty
Demographics Similar to Germans by Single Female Poverty
In terms of single female poverty, the demographic groups most similar to Germans are Immigrants from Grenada (21.8%, a difference of 0.050%), Immigrants from Eritrea (21.8%, a difference of 0.070%), Panamanian (21.7%, a difference of 0.21%), Scottish (21.8%, a difference of 0.21%), and Barbadian (21.8%, a difference of 0.23%).
| Demographics | Rating | Rank | Single Female Poverty |
| Guamanians/Chamorros | 13.7 /100 | #213 | Poor 21.6% |
| Immigrants | Nicaragua | 13.3 /100 | #214 | Poor 21.6% |
| Ecuadorians | 12.3 /100 | #215 | Poor 21.6% |
| Immigrants | Barbados | 12.2 /100 | #216 | Poor 21.7% |
| Immigrants | St. Vincent and the Grenadines | 11.7 /100 | #217 | Poor 21.7% |
| Nepalese | 9.7 /100 | #218 | Tragic 21.7% |
| Panamanians | 9.4 /100 | #219 | Tragic 21.7% |
| Germans | 8.3 /100 | #220 | Tragic 21.8% |
| Immigrants | Grenada | 8.0 /100 | #221 | Tragic 21.8% |
| Immigrants | Eritrea | 7.9 /100 | #222 | Tragic 21.8% |
| Scottish | 7.3 /100 | #223 | Tragic 21.8% |
| Barbadians | 7.2 /100 | #224 | Tragic 21.8% |
| English | 6.4 /100 | #225 | Tragic 21.9% |
| Immigrants | Portugal | 5.8 /100 | #226 | Tragic 21.9% |
| Immigrants | Ghana | 5.8 /100 | #227 | Tragic 21.9% |
Demographics Similar to Scandinavians by Single Female Poverty
In terms of single female poverty, the demographic groups most similar to Scandinavians are Canadian (21.1%, a difference of 0.010%), Immigrants from Bosnia and Herzegovina (21.1%, a difference of 0.020%), Czech (21.0%, a difference of 0.10%), British (21.1%, a difference of 0.14%), and Spanish American Indian (21.1%, a difference of 0.17%).
| Demographics | Rating | Rank | Single Female Poverty |
| New Zealanders | 53.2 /100 | #170 | Average 21.0% |
| Moroccans | 52.8 /100 | #171 | Average 21.0% |
| Guyanese | 52.0 /100 | #172 | Average 21.0% |
| Immigrants | Guyana | 50.6 /100 | #173 | Average 21.0% |
| Cubans | 50.0 /100 | #174 | Average 21.0% |
| Czechs | 46.8 /100 | #175 | Average 21.0% |
| Canadians | 45.4 /100 | #176 | Average 21.1% |
| Scandinavians | 45.2 /100 | #177 | Average 21.1% |
| Immigrants | Bosnia and Herzegovina | 44.9 /100 | #178 | Average 21.1% |
| British | 42.9 /100 | #179 | Average 21.1% |
| Spanish American Indians | 42.5 /100 | #180 | Average 21.1% |
| Europeans | 42.3 /100 | #181 | Average 21.1% |
| Slavs | 40.5 /100 | #182 | Average 21.1% |
| Slovaks | 39.7 /100 | #183 | Fair 21.1% |
| Hungarians | 39.6 /100 | #184 | Fair 21.1% |