Immigrants from Portugal vs Turkish Female Poverty
COMPARE
Immigrants from Portugal
Turkish
Female Poverty
Female Poverty Comparison
Immigrants from Portugal
Turks
13.6%
FEMALE POVERTY
41.5/ 100
METRIC RATING
186th/ 347
METRIC RANK
11.9%
FEMALE POVERTY
99.2/ 100
METRIC RATING
46th/ 347
METRIC RANK
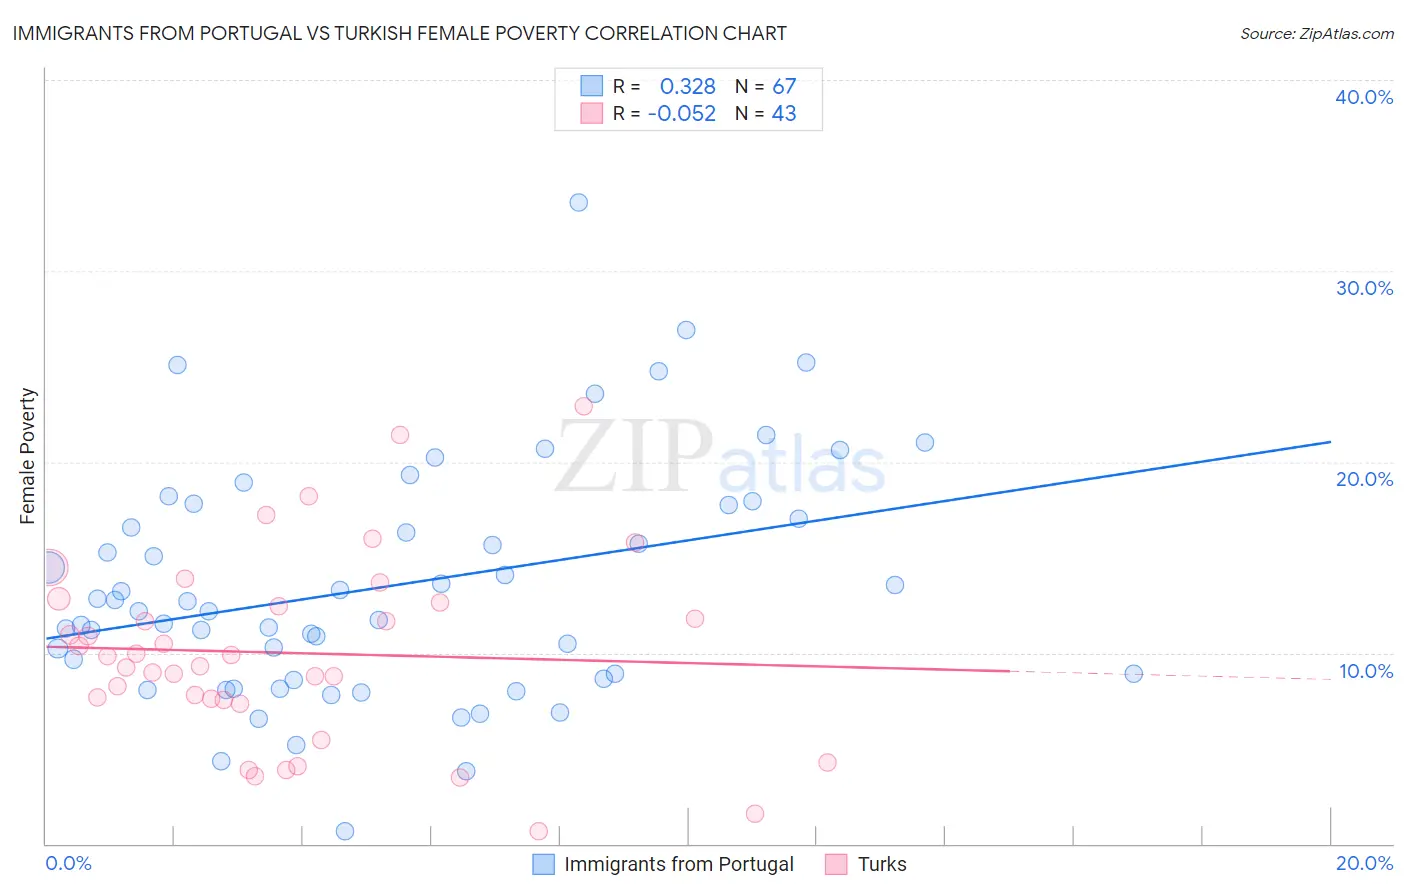
Immigrants from Portugal vs Turkish Female Poverty Correlation Chart
The statistical analysis conducted on geographies consisting of 174,717,280 people shows a mild positive correlation between the proportion of Immigrants from Portugal and poverty level among females in the United States with a correlation coefficient (R) of 0.328 and weighted average of 13.6%. Similarly, the statistical analysis conducted on geographies consisting of 271,658,978 people shows a slight negative correlation between the proportion of Turks and poverty level among females in the United States with a correlation coefficient (R) of -0.052 and weighted average of 11.9%, a difference of 13.9%.
Female Poverty Correlation Summary
| Measurement | Immigrants from Portugal | Turkish |
| Minimum | 0.65% | 0.67% |
| Maximum | 33.6% | 22.9% |
| Range | 32.9% | 22.2% |
| Mean | 13.5% | 10.0% |
| Median | 12.2% | 9.8% |
| Interquartile 25% (IQ1) | 8.6% | 7.5% |
| Interquartile 75% (IQ3) | 17.8% | 12.6% |
| Interquartile Range (IQR) | 9.1% | 5.1% |
| Standard Deviation (Sample) | 6.2% | 4.9% |
| Standard Deviation (Population) | 6.1% | 4.8% |
Similar Demographics by Female Poverty
Demographics Similar to Immigrants from Portugal by Female Poverty
In terms of female poverty, the demographic groups most similar to Immigrants from Portugal are Immigrants from Venezuela (13.6%, a difference of 0.050%), Immigrants from Cameroon (13.5%, a difference of 0.060%), Hawaiian (13.6%, a difference of 0.16%), Immigrants from Sierra Leone (13.5%, a difference of 0.17%), and Uruguayan (13.6%, a difference of 0.17%).
| Demographics | Rating | Rank | Female Poverty |
| Immigrants | Syria | 48.8 /100 | #179 | Average 13.5% |
| South Americans | 44.8 /100 | #180 | Average 13.5% |
| Venezuelans | 44.5 /100 | #181 | Average 13.5% |
| Immigrants | Colombia | 44.5 /100 | #182 | Average 13.5% |
| Kenyans | 43.8 /100 | #183 | Average 13.5% |
| Immigrants | Sierra Leone | 43.2 /100 | #184 | Average 13.5% |
| Immigrants | Cameroon | 42.0 /100 | #185 | Average 13.5% |
| Immigrants | Portugal | 41.5 /100 | #186 | Average 13.6% |
| Immigrants | Venezuela | 41.0 /100 | #187 | Average 13.6% |
| Hawaiians | 39.9 /100 | #188 | Fair 13.6% |
| Uruguayans | 39.8 /100 | #189 | Fair 13.6% |
| Sierra Leoneans | 33.1 /100 | #190 | Fair 13.7% |
| Immigrants | Kuwait | 32.7 /100 | #191 | Fair 13.7% |
| Immigrants | Costa Rica | 31.9 /100 | #192 | Fair 13.7% |
| Iraqis | 31.8 /100 | #193 | Fair 13.7% |
Demographics Similar to Turks by Female Poverty
In terms of female poverty, the demographic groups most similar to Turks are Immigrants from Czechoslovakia (11.9%, a difference of 0.0%), Tongan (11.9%, a difference of 0.10%), Korean (11.9%, a difference of 0.16%), Czech (11.9%, a difference of 0.20%), and Immigrants from Moldova (11.9%, a difference of 0.20%).
| Demographics | Rating | Rank | Female Poverty |
| Immigrants | Poland | 99.3 /100 | #39 | Exceptional 11.8% |
| Macedonians | 99.3 /100 | #40 | Exceptional 11.8% |
| Czechs | 99.2 /100 | #41 | Exceptional 11.9% |
| Immigrants | Moldova | 99.2 /100 | #42 | Exceptional 11.9% |
| Koreans | 99.2 /100 | #43 | Exceptional 11.9% |
| Tongans | 99.2 /100 | #44 | Exceptional 11.9% |
| Immigrants | Czechoslovakia | 99.2 /100 | #45 | Exceptional 11.9% |
| Turks | 99.2 /100 | #46 | Exceptional 11.9% |
| Asians | 99.1 /100 | #47 | Exceptional 11.9% |
| Immigrants | Japan | 99.0 /100 | #48 | Exceptional 11.9% |
| Immigrants | Romania | 99.0 /100 | #49 | Exceptional 12.0% |
| Slovenes | 98.9 /100 | #50 | Exceptional 12.0% |
| Immigrants | Bulgaria | 98.9 /100 | #51 | Exceptional 12.0% |
| Immigrants | Croatia | 98.7 /100 | #52 | Exceptional 12.0% |
| Immigrants | Austria | 98.7 /100 | #53 | Exceptional 12.0% |