Immigrants from Portugal vs Colville Female Poverty
COMPARE
Immigrants from Portugal
Colville
Female Poverty
Female Poverty Comparison
Immigrants from Portugal
Colville
13.6%
FEMALE POVERTY
41.5/ 100
METRIC RATING
186th/ 347
METRIC RANK
17.8%
FEMALE POVERTY
0.0/ 100
METRIC RATING
325th/ 347
METRIC RANK
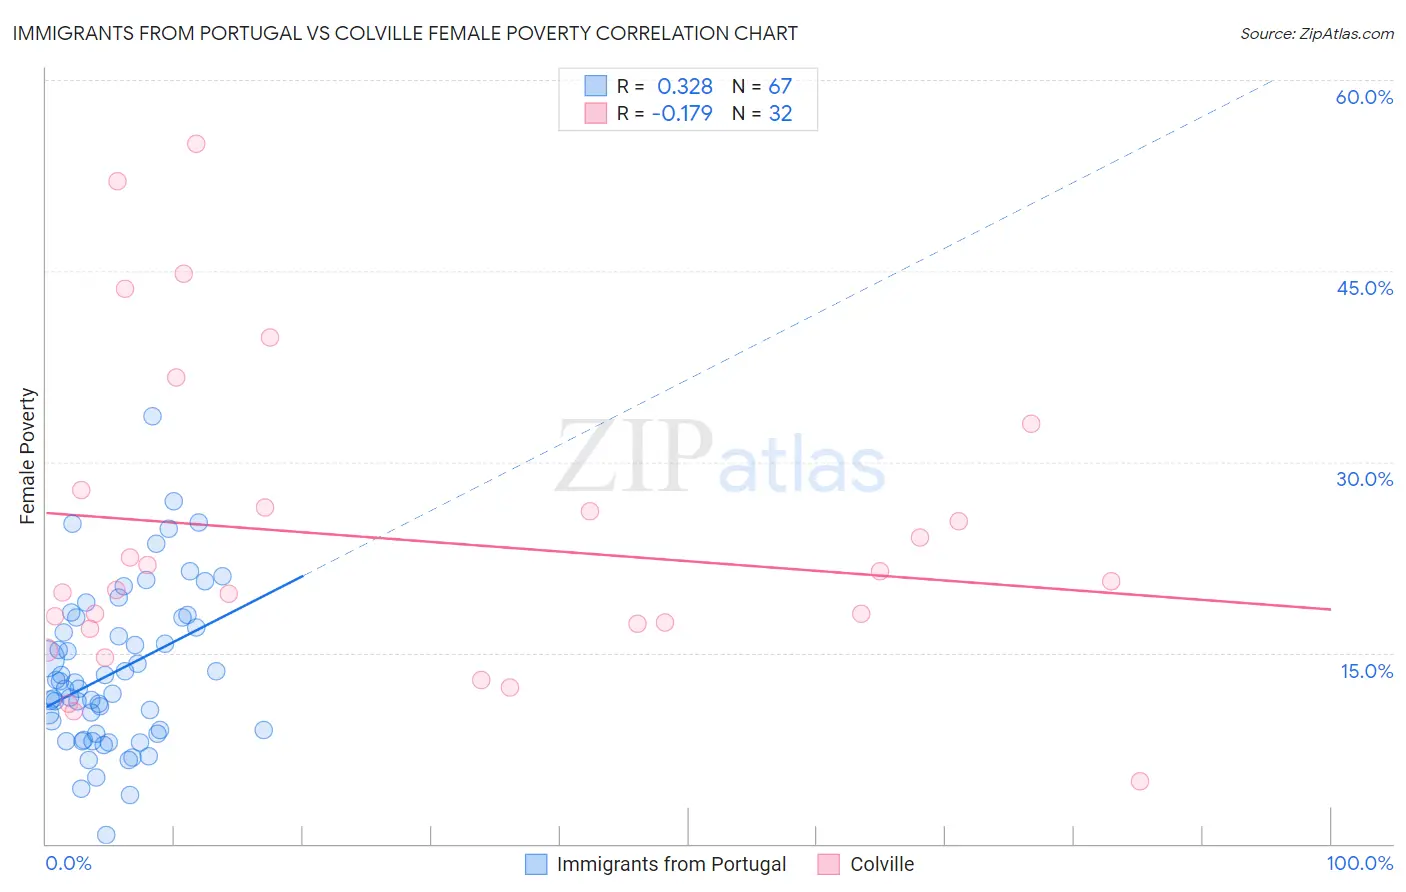
Immigrants from Portugal vs Colville Female Poverty Correlation Chart
The statistical analysis conducted on geographies consisting of 174,717,280 people shows a mild positive correlation between the proportion of Immigrants from Portugal and poverty level among females in the United States with a correlation coefficient (R) of 0.328 and weighted average of 13.6%. Similarly, the statistical analysis conducted on geographies consisting of 34,683,494 people shows a poor negative correlation between the proportion of Colville and poverty level among females in the United States with a correlation coefficient (R) of -0.179 and weighted average of 17.8%, a difference of 31.0%.
Female Poverty Correlation Summary
| Measurement | Immigrants from Portugal | Colville |
| Minimum | 0.65% | 4.9% |
| Maximum | 33.6% | 55.0% |
| Range | 32.9% | 50.1% |
| Mean | 13.5% | 24.0% |
| Median | 12.2% | 20.3% |
| Interquartile 25% (IQ1) | 8.6% | 17.1% |
| Interquartile 75% (IQ3) | 17.8% | 27.1% |
| Interquartile Range (IQR) | 9.1% | 10.0% |
| Standard Deviation (Sample) | 6.2% | 12.1% |
| Standard Deviation (Population) | 6.1% | 11.9% |
Similar Demographics by Female Poverty
Demographics Similar to Immigrants from Portugal by Female Poverty
In terms of female poverty, the demographic groups most similar to Immigrants from Portugal are Immigrants from Venezuela (13.6%, a difference of 0.050%), Immigrants from Cameroon (13.5%, a difference of 0.060%), Hawaiian (13.6%, a difference of 0.16%), Immigrants from Sierra Leone (13.5%, a difference of 0.17%), and Uruguayan (13.6%, a difference of 0.17%).
| Demographics | Rating | Rank | Female Poverty |
| Immigrants | Syria | 48.8 /100 | #179 | Average 13.5% |
| South Americans | 44.8 /100 | #180 | Average 13.5% |
| Venezuelans | 44.5 /100 | #181 | Average 13.5% |
| Immigrants | Colombia | 44.5 /100 | #182 | Average 13.5% |
| Kenyans | 43.8 /100 | #183 | Average 13.5% |
| Immigrants | Sierra Leone | 43.2 /100 | #184 | Average 13.5% |
| Immigrants | Cameroon | 42.0 /100 | #185 | Average 13.5% |
| Immigrants | Portugal | 41.5 /100 | #186 | Average 13.6% |
| Immigrants | Venezuela | 41.0 /100 | #187 | Average 13.6% |
| Hawaiians | 39.9 /100 | #188 | Fair 13.6% |
| Uruguayans | 39.8 /100 | #189 | Fair 13.6% |
| Sierra Leoneans | 33.1 /100 | #190 | Fair 13.7% |
| Immigrants | Kuwait | 32.7 /100 | #191 | Fair 13.7% |
| Immigrants | Costa Rica | 31.9 /100 | #192 | Fair 13.7% |
| Iraqis | 31.8 /100 | #193 | Fair 13.7% |
Demographics Similar to Colville by Female Poverty
In terms of female poverty, the demographic groups most similar to Colville are Immigrants from Honduras (17.7%, a difference of 0.15%), Paiute (17.7%, a difference of 0.34%), Menominee (17.6%, a difference of 0.93%), Central American Indian (18.0%, a difference of 1.5%), and Arapaho (17.5%, a difference of 1.6%).
| Demographics | Rating | Rank | Female Poverty |
| Ute | 0.0 /100 | #318 | Tragic 17.5% |
| Cajuns | 0.0 /100 | #319 | Tragic 17.5% |
| Immigrants | Dominica | 0.0 /100 | #320 | Tragic 17.5% |
| Arapaho | 0.0 /100 | #321 | Tragic 17.5% |
| Menominee | 0.0 /100 | #322 | Tragic 17.6% |
| Paiute | 0.0 /100 | #323 | Tragic 17.7% |
| Immigrants | Honduras | 0.0 /100 | #324 | Tragic 17.7% |
| Colville | 0.0 /100 | #325 | Tragic 17.8% |
| Central American Indians | 0.0 /100 | #326 | Tragic 18.0% |
| Yakama | 0.0 /100 | #327 | Tragic 18.0% |
| Blacks/African Americans | 0.0 /100 | #328 | Tragic 18.6% |
| Kiowa | 0.0 /100 | #329 | Tragic 18.6% |
| Dominicans | 0.0 /100 | #330 | Tragic 19.1% |
| Natives/Alaskans | 0.0 /100 | #331 | Tragic 19.2% |
| Apache | 0.0 /100 | #332 | Tragic 19.2% |