Immigrants from Portugal vs Turkish Disability Age 65 to 74
COMPARE
Immigrants from Portugal
Turkish
Disability Age 65 to 74
Disability Age 65 to 74 Comparison
Immigrants from Portugal
Turks
24.0%
DISABILITY AGE 65 TO 74
11.7/ 100
METRIC RATING
217th/ 347
METRIC RANK
21.0%
DISABILITY AGE 65 TO 74
99.9/ 100
METRIC RATING
32nd/ 347
METRIC RANK
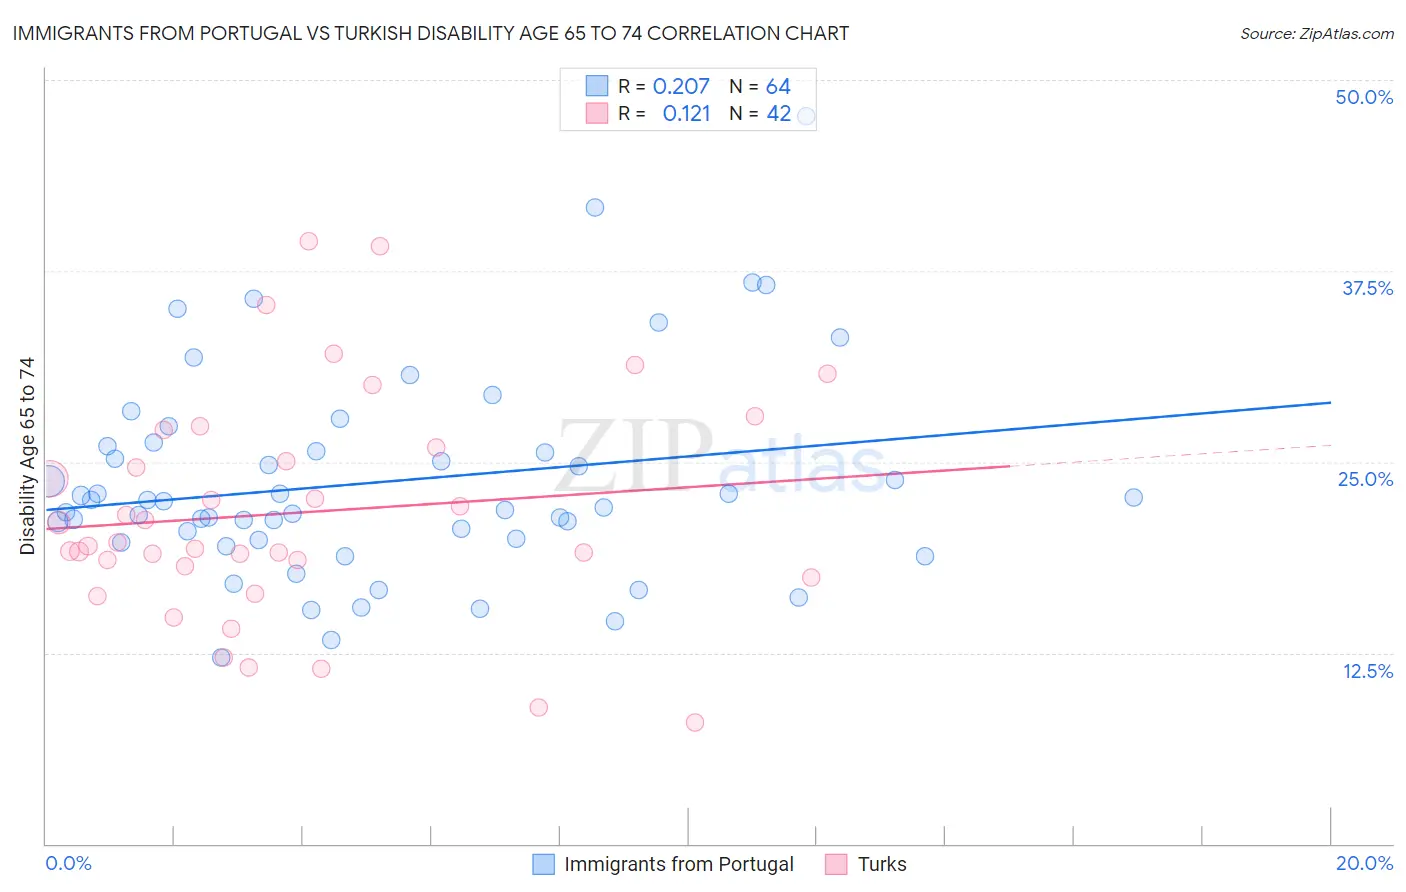
Immigrants from Portugal vs Turkish Disability Age 65 to 74 Correlation Chart
The statistical analysis conducted on geographies consisting of 174,709,708 people shows a weak positive correlation between the proportion of Immigrants from Portugal and percentage of population with a disability between the ages 65 and 75 in the United States with a correlation coefficient (R) of 0.207 and weighted average of 24.0%. Similarly, the statistical analysis conducted on geographies consisting of 271,478,779 people shows a poor positive correlation between the proportion of Turks and percentage of population with a disability between the ages 65 and 75 in the United States with a correlation coefficient (R) of 0.121 and weighted average of 21.0%, a difference of 14.2%.
Disability Age 65 to 74 Correlation Summary
| Measurement | Immigrants from Portugal | Turkish |
| Minimum | 12.2% | 7.9% |
| Maximum | 47.6% | 39.4% |
| Range | 35.4% | 31.5% |
| Mean | 23.7% | 21.7% |
| Median | 22.2% | 19.6% |
| Interquartile 25% (IQ1) | 19.9% | 18.2% |
| Interquartile 75% (IQ3) | 25.9% | 26.0% |
| Interquartile Range (IQR) | 5.9% | 7.8% |
| Standard Deviation (Sample) | 6.8% | 7.4% |
| Standard Deviation (Population) | 6.7% | 7.3% |
Similar Demographics by Disability Age 65 to 74
Demographics Similar to Immigrants from Portugal by Disability Age 65 to 74
In terms of disability age 65 to 74, the demographic groups most similar to Immigrants from Portugal are Immigrants from Nigeria (24.0%, a difference of 0.0%), Immigrants from Burma/Myanmar (24.0%, a difference of 0.020%), Jamaican (24.0%, a difference of 0.070%), Ghanaian (24.1%, a difference of 0.19%), and Pennsylvania German (24.0%, a difference of 0.20%).
| Demographics | Rating | Rank | Disability Age 65 to 74 |
| Trinidadians and Tobagonians | 16.4 /100 | #210 | Poor 23.9% |
| Immigrants | West Indies | 15.9 /100 | #211 | Poor 23.9% |
| French | 15.7 /100 | #212 | Poor 23.9% |
| Nicaraguans | 14.3 /100 | #213 | Poor 23.9% |
| Immigrants | Oceania | 13.6 /100 | #214 | Poor 24.0% |
| Pennsylvania Germans | 13.3 /100 | #215 | Poor 24.0% |
| Jamaicans | 12.2 /100 | #216 | Poor 24.0% |
| Immigrants | Portugal | 11.7 /100 | #217 | Poor 24.0% |
| Immigrants | Nigeria | 11.7 /100 | #218 | Poor 24.0% |
| Immigrants | Burma/Myanmar | 11.6 /100 | #219 | Poor 24.0% |
| Ghanaians | 10.4 /100 | #220 | Poor 24.1% |
| Immigrants | Nicaragua | 9.8 /100 | #221 | Tragic 24.1% |
| Native Hawaiians | 9.3 /100 | #222 | Tragic 24.1% |
| Immigrants | Middle Africa | 8.9 /100 | #223 | Tragic 24.1% |
| Immigrants | Panama | 8.6 /100 | #224 | Tragic 24.1% |
Demographics Similar to Turks by Disability Age 65 to 74
In terms of disability age 65 to 74, the demographic groups most similar to Turks are Immigrants from Northern Europe (21.0%, a difference of 0.030%), Immigrants from Greece (21.0%, a difference of 0.070%), Immigrants from Japan (21.0%, a difference of 0.11%), Immigrants from Czechoslovakia (21.0%, a difference of 0.15%), and Immigrants from Argentina (21.1%, a difference of 0.20%).
| Demographics | Rating | Rank | Disability Age 65 to 74 |
| Bolivians | 99.9 /100 | #25 | Exceptional 21.0% |
| Immigrants | Australia | 99.9 /100 | #26 | Exceptional 21.0% |
| Immigrants | Sweden | 99.9 /100 | #27 | Exceptional 21.0% |
| Immigrants | Czechoslovakia | 99.9 /100 | #28 | Exceptional 21.0% |
| Immigrants | Japan | 99.9 /100 | #29 | Exceptional 21.0% |
| Immigrants | Greece | 99.9 /100 | #30 | Exceptional 21.0% |
| Immigrants | Northern Europe | 99.9 /100 | #31 | Exceptional 21.0% |
| Turks | 99.9 /100 | #32 | Exceptional 21.0% |
| Immigrants | Argentina | 99.9 /100 | #33 | Exceptional 21.1% |
| Immigrants | Sri Lanka | 99.9 /100 | #34 | Exceptional 21.1% |
| Bulgarians | 99.9 /100 | #35 | Exceptional 21.1% |
| Immigrants | Switzerland | 99.8 /100 | #36 | Exceptional 21.1% |
| Israelis | 99.8 /100 | #37 | Exceptional 21.2% |
| Russians | 99.8 /100 | #38 | Exceptional 21.2% |
| Argentineans | 99.8 /100 | #39 | Exceptional 21.2% |