Immigrants from Portugal vs Turkish Unemployment Among Women with Children Under 6 years
COMPARE
Immigrants from Portugal
Turkish
Unemployment Among Women with Children Under 6 years
Unemployment Among Women with Children Under 6 years Comparison
Immigrants from Portugal
Turks
8.3%
UNEMPLOYMENT AMONG WOMEN WITH CHILDREN UNDER 6 YEARS
0.6/ 100
METRIC RATING
255th/ 347
METRIC RANK
7.0%
UNEMPLOYMENT AMONG WOMEN WITH CHILDREN UNDER 6 YEARS
99.2/ 100
METRIC RATING
74th/ 347
METRIC RANK
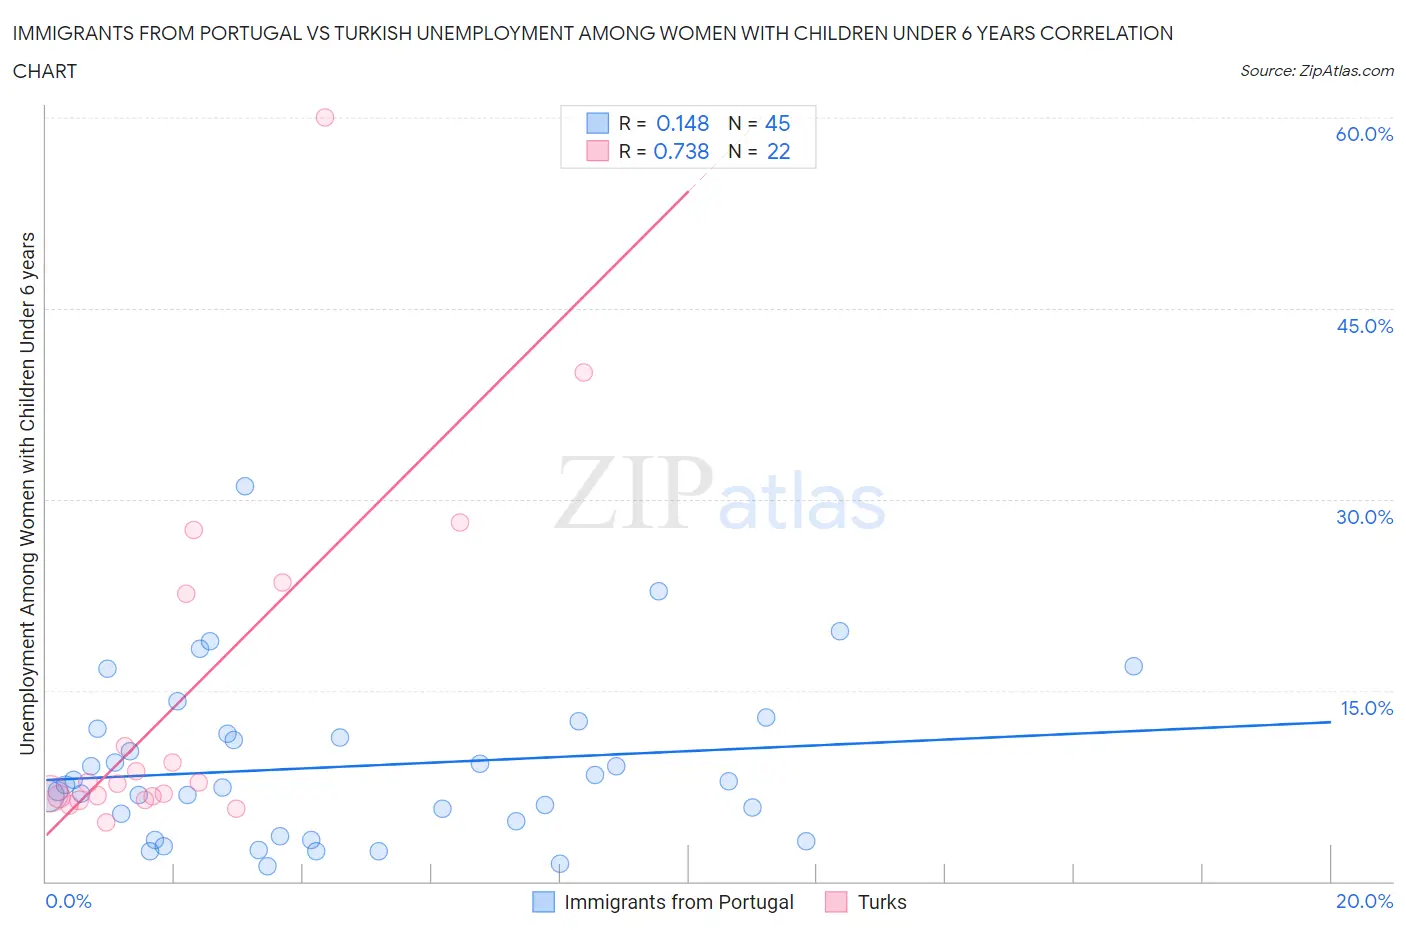
Immigrants from Portugal vs Turkish Unemployment Among Women with Children Under 6 years Correlation Chart
The statistical analysis conducted on geographies consisting of 145,443,316 people shows a poor positive correlation between the proportion of Immigrants from Portugal and unemployment rate among women with children under the age of 6 in the United States with a correlation coefficient (R) of 0.148 and weighted average of 8.3%. Similarly, the statistical analysis conducted on geographies consisting of 219,764,110 people shows a strong positive correlation between the proportion of Turks and unemployment rate among women with children under the age of 6 in the United States with a correlation coefficient (R) of 0.738 and weighted average of 7.0%, a difference of 17.8%.
Unemployment Among Women with Children Under 6 years Correlation Summary
| Measurement | Immigrants from Portugal | Turkish |
| Minimum | 1.2% | 4.6% |
| Maximum | 31.0% | 60.0% |
| Range | 29.8% | 55.4% |
| Mean | 9.0% | 14.4% |
| Median | 7.5% | 7.7% |
| Interquartile 25% (IQ1) | 4.1% | 6.6% |
| Interquartile 75% (IQ3) | 11.8% | 22.6% |
| Interquartile Range (IQR) | 7.7% | 16.0% |
| Standard Deviation (Sample) | 6.3% | 14.0% |
| Standard Deviation (Population) | 6.2% | 13.7% |
Similar Demographics by Unemployment Among Women with Children Under 6 years
Demographics Similar to Immigrants from Portugal by Unemployment Among Women with Children Under 6 years
In terms of unemployment among women with children under 6 years, the demographic groups most similar to Immigrants from Portugal are Celtic (8.3%, a difference of 0.020%), British West Indian (8.3%, a difference of 0.27%), Immigrants from Caribbean (8.3%, a difference of 0.29%), Immigrants from Ghana (8.3%, a difference of 0.30%), and Immigrants from Guyana (8.2%, a difference of 0.56%).
| Demographics | Rating | Rank | Unemployment Among Women with Children Under 6 years |
| Immigrants | Western Africa | 1.1 /100 | #248 | Tragic 8.2% |
| Immigrants | Sierra Leone | 1.1 /100 | #249 | Tragic 8.2% |
| Nigerians | 1.1 /100 | #250 | Tragic 8.2% |
| Guyanese | 1.0 /100 | #251 | Tragic 8.2% |
| Ghanaians | 1.0 /100 | #252 | Tragic 8.2% |
| Immigrants | Guyana | 0.8 /100 | #253 | Tragic 8.2% |
| Immigrants | Caribbean | 0.7 /100 | #254 | Tragic 8.3% |
| Immigrants | Portugal | 0.6 /100 | #255 | Tragic 8.3% |
| Celtics | 0.6 /100 | #256 | Tragic 8.3% |
| British West Indians | 0.5 /100 | #257 | Tragic 8.3% |
| Immigrants | Ghana | 0.5 /100 | #258 | Tragic 8.3% |
| Barbadians | 0.4 /100 | #259 | Tragic 8.3% |
| Whites/Caucasians | 0.3 /100 | #260 | Tragic 8.4% |
| Immigrants | Liberia | 0.3 /100 | #261 | Tragic 8.4% |
| West Indians | 0.3 /100 | #262 | Tragic 8.4% |
Demographics Similar to Turks by Unemployment Among Women with Children Under 6 years
In terms of unemployment among women with children under 6 years, the demographic groups most similar to Turks are Immigrants from Czechoslovakia (7.0%, a difference of 0.010%), Immigrants from Eastern Europe (7.1%, a difference of 0.40%), Estonian (7.1%, a difference of 0.45%), Immigrants from Croatia (7.1%, a difference of 0.48%), and Immigrants from Somalia (7.1%, a difference of 0.52%).
| Demographics | Rating | Rank | Unemployment Among Women with Children Under 6 years |
| Immigrants | Netherlands | 99.5 /100 | #67 | Exceptional 7.0% |
| Paraguayans | 99.4 /100 | #68 | Exceptional 7.0% |
| Immigrants | Eritrea | 99.4 /100 | #69 | Exceptional 7.0% |
| Immigrants | Iraq | 99.4 /100 | #70 | Exceptional 7.0% |
| Afghans | 99.4 /100 | #71 | Exceptional 7.0% |
| Cubans | 99.4 /100 | #72 | Exceptional 7.0% |
| Immigrants | Czechoslovakia | 99.2 /100 | #73 | Exceptional 7.0% |
| Turks | 99.2 /100 | #74 | Exceptional 7.0% |
| Immigrants | Eastern Europe | 99.0 /100 | #75 | Exceptional 7.1% |
| Estonians | 99.0 /100 | #76 | Exceptional 7.1% |
| Immigrants | Croatia | 98.9 /100 | #77 | Exceptional 7.1% |
| Immigrants | Somalia | 98.9 /100 | #78 | Exceptional 7.1% |
| Immigrants | Fiji | 98.9 /100 | #79 | Exceptional 7.1% |
| Immigrants | Greece | 98.9 /100 | #80 | Exceptional 7.1% |
| Immigrants | Venezuela | 98.8 /100 | #81 | Exceptional 7.1% |