Immigrants from Portugal vs Turkish 5th Grade
COMPARE
Immigrants from Portugal
Turkish
5th Grade
5th Grade Comparison
Immigrants from Portugal
Turks
95.9%
5TH GRADE
0.0/ 100
METRIC RATING
314th/ 347
METRIC RANK
97.7%
5TH GRADE
98.3/ 100
METRIC RATING
99th/ 347
METRIC RANK
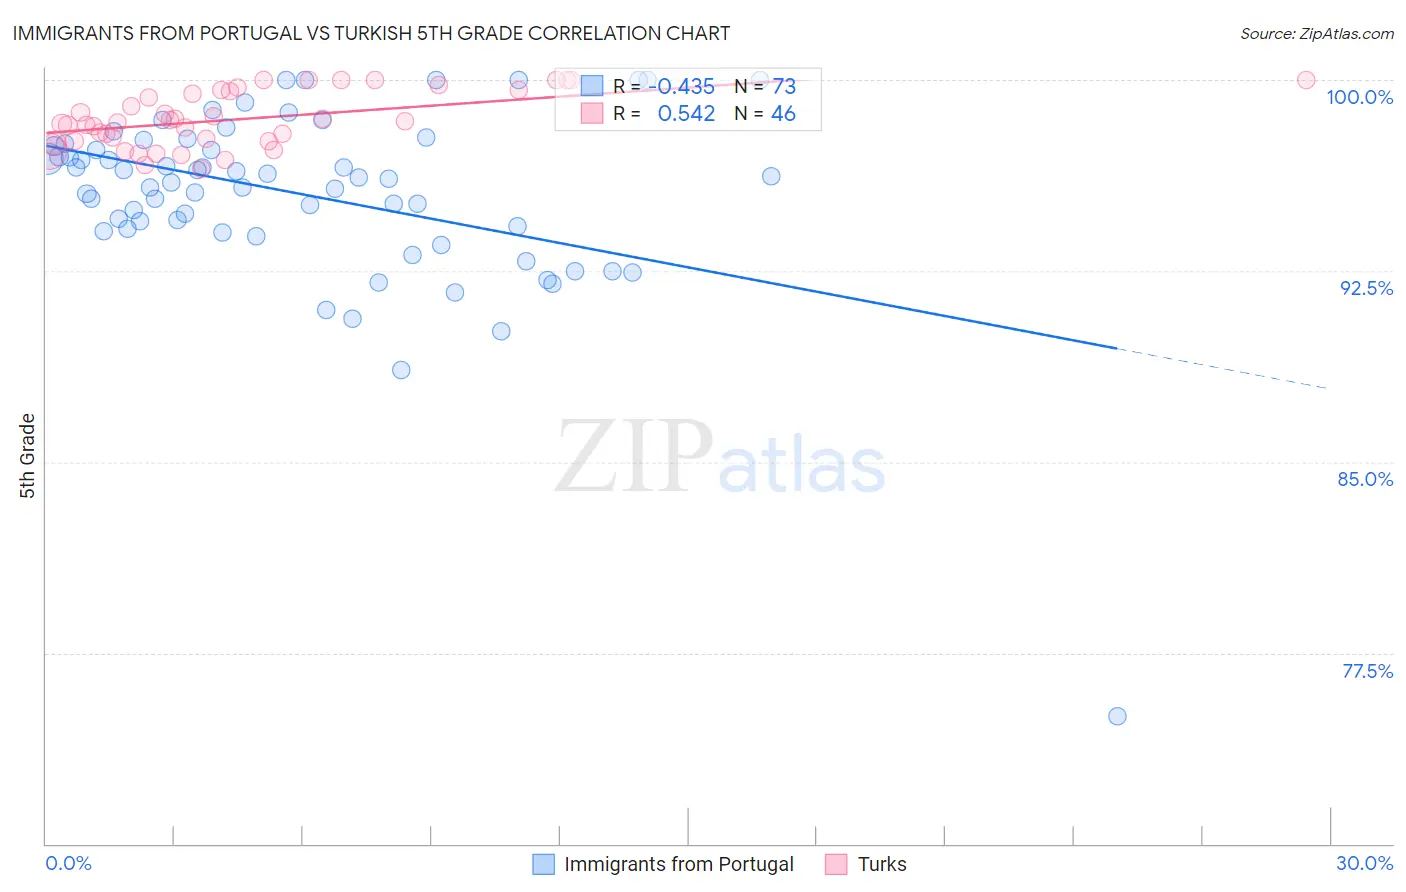
Immigrants from Portugal vs Turkish 5th Grade Correlation Chart
The statistical analysis conducted on geographies consisting of 174,792,107 people shows a moderate negative correlation between the proportion of Immigrants from Portugal and percentage of population with at least 5th grade education in the United States with a correlation coefficient (R) of -0.435 and weighted average of 95.9%. Similarly, the statistical analysis conducted on geographies consisting of 271,858,657 people shows a substantial positive correlation between the proportion of Turks and percentage of population with at least 5th grade education in the United States with a correlation coefficient (R) of 0.542 and weighted average of 97.7%, a difference of 1.9%.
5th Grade Correlation Summary
| Measurement | Immigrants from Portugal | Turkish |
| Minimum | 75.0% | 96.5% |
| Maximum | 100.0% | 100.0% |
| Range | 25.0% | 3.5% |
| Mean | 95.5% | 98.5% |
| Median | 96.1% | 98.4% |
| Interquartile 25% (IQ1) | 94.1% | 97.6% |
| Interquartile 75% (IQ3) | 97.5% | 99.6% |
| Interquartile Range (IQR) | 3.4% | 2.0% |
| Standard Deviation (Sample) | 3.5% | 1.1% |
| Standard Deviation (Population) | 3.5% | 1.1% |
Similar Demographics by 5th Grade
Demographics Similar to Immigrants from Portugal by 5th Grade
In terms of 5th grade, the demographic groups most similar to Immigrants from Portugal are Bangladeshi (95.9%, a difference of 0.0%), Vietnamese (95.9%, a difference of 0.020%), Nicaraguan (95.9%, a difference of 0.020%), Immigrants from Bangladesh (96.0%, a difference of 0.050%), and Indonesian (96.0%, a difference of 0.070%).
| Demographics | Rating | Rank | 5th Grade |
| Immigrants | Caribbean | 0.0 /100 | #307 | Tragic 96.0% |
| Ecuadorians | 0.0 /100 | #308 | Tragic 96.0% |
| Immigrants | Guyana | 0.0 /100 | #309 | Tragic 96.0% |
| Indonesians | 0.0 /100 | #310 | Tragic 96.0% |
| Immigrants | Bangladesh | 0.0 /100 | #311 | Tragic 96.0% |
| Vietnamese | 0.0 /100 | #312 | Tragic 95.9% |
| Bangladeshis | 0.0 /100 | #313 | Tragic 95.9% |
| Immigrants | Portugal | 0.0 /100 | #314 | Tragic 95.9% |
| Nicaraguans | 0.0 /100 | #315 | Tragic 95.9% |
| Immigrants | Ecuador | 0.0 /100 | #316 | Tragic 95.8% |
| Belizeans | 0.0 /100 | #317 | Tragic 95.8% |
| Immigrants | Vietnam | 0.0 /100 | #318 | Tragic 95.8% |
| Japanese | 0.0 /100 | #319 | Tragic 95.7% |
| Central American Indians | 0.0 /100 | #320 | Tragic 95.7% |
| Immigrants | Belize | 0.0 /100 | #321 | Tragic 95.7% |
Demographics Similar to Turks by 5th Grade
In terms of 5th grade, the demographic groups most similar to Turks are Yugoslavian (97.7%, a difference of 0.0%), Puget Sound Salish (97.7%, a difference of 0.0%), South African (97.7%, a difference of 0.0%), Cree (97.7%, a difference of 0.010%), and Delaware (97.8%, a difference of 0.020%).
| Demographics | Rating | Rank | 5th Grade |
| Immigrants | Sweden | 98.7 /100 | #92 | Exceptional 97.8% |
| Delaware | 98.6 /100 | #93 | Exceptional 97.8% |
| Immigrants | Denmark | 98.6 /100 | #94 | Exceptional 97.8% |
| Romanians | 98.6 /100 | #95 | Exceptional 97.8% |
| Immigrants | Germany | 98.5 /100 | #96 | Exceptional 97.8% |
| Cree | 98.4 /100 | #97 | Exceptional 97.7% |
| Yugoslavians | 98.3 /100 | #98 | Exceptional 97.7% |
| Turks | 98.3 /100 | #99 | Exceptional 97.7% |
| Puget Sound Salish | 98.3 /100 | #100 | Exceptional 97.7% |
| South Africans | 98.3 /100 | #101 | Exceptional 97.7% |
| Choctaw | 98.0 /100 | #102 | Exceptional 97.7% |
| Cheyenne | 97.9 /100 | #103 | Exceptional 97.7% |
| German Russians | 97.8 /100 | #104 | Exceptional 97.7% |
| Bhutanese | 97.6 /100 | #105 | Exceptional 97.7% |
| Immigrants | Czechoslovakia | 97.5 /100 | #106 | Exceptional 97.7% |