Immigrants from Poland vs Houma Householder Income Ages 25 - 44 years
COMPARE
Immigrants from Poland
Houma
Householder Income Ages 25 - 44 years
Householder Income Ages 25 - 44 years Comparison
Immigrants from Poland
Houma
$101,065
HOUSEHOLDER INCOME AGES 25 - 44 YEARS
97.4/ 100
METRIC RATING
104th/ 347
METRIC RANK
$77,044
HOUSEHOLDER INCOME AGES 25 - 44 YEARS
0.0/ 100
METRIC RATING
326th/ 347
METRIC RANK
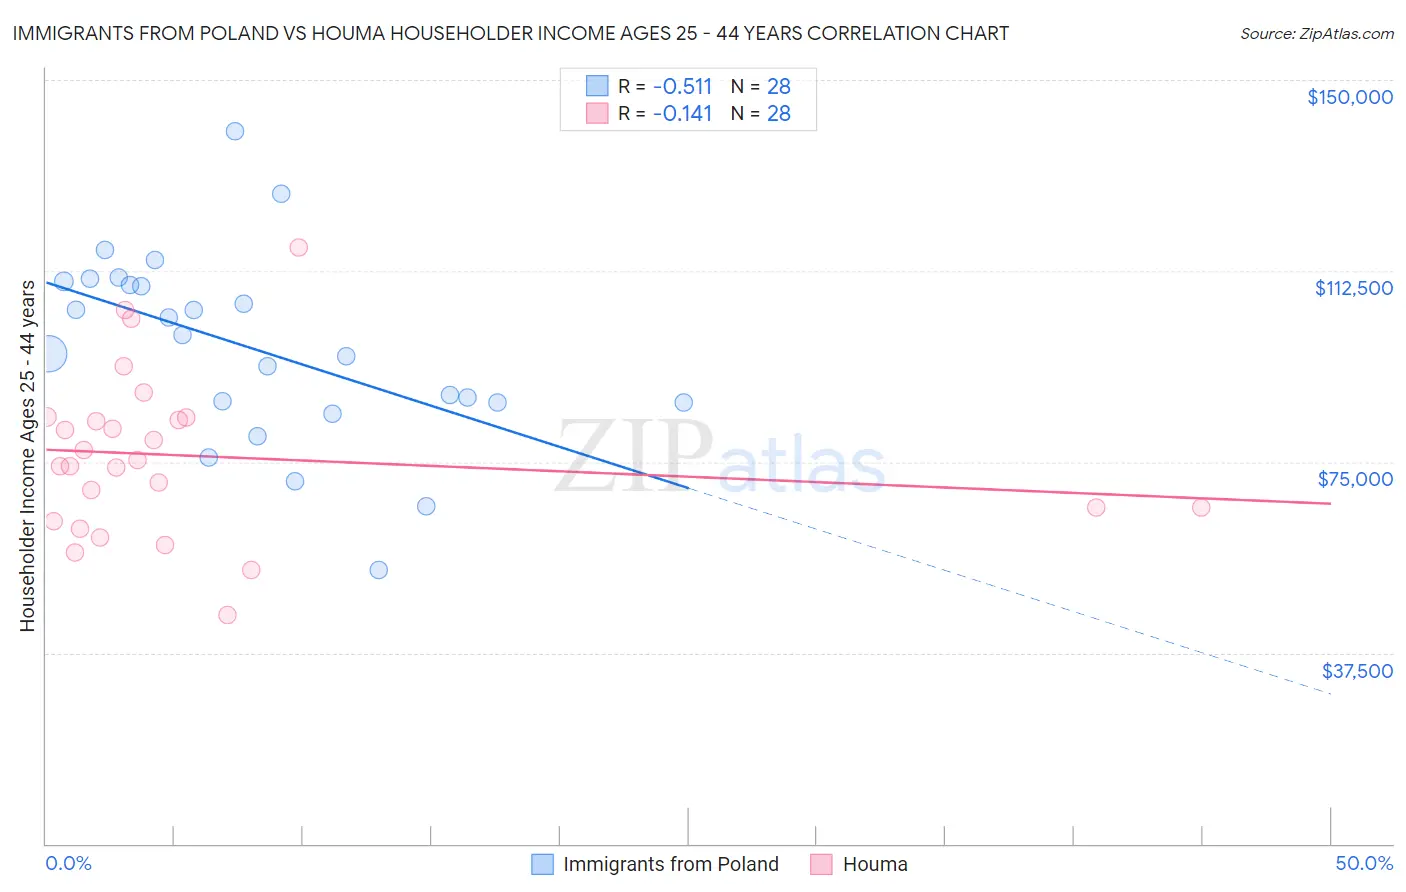
Immigrants from Poland vs Houma Householder Income Ages 25 - 44 years Correlation Chart
The statistical analysis conducted on geographies consisting of 304,269,363 people shows a substantial negative correlation between the proportion of Immigrants from Poland and household income with householder between the ages 25 and 44 in the United States with a correlation coefficient (R) of -0.511 and weighted average of $101,065. Similarly, the statistical analysis conducted on geographies consisting of 36,744,797 people shows a poor negative correlation between the proportion of Houma and household income with householder between the ages 25 and 44 in the United States with a correlation coefficient (R) of -0.141 and weighted average of $77,044, a difference of 31.2%.
Householder Income Ages 25 - 44 years Correlation Summary
| Measurement | Immigrants from Poland | Houma |
| Minimum | $53,849 | $44,839 |
| Maximum | $139,903 | $117,083 |
| Range | $86,054 | $72,244 |
| Mean | $97,277 | $76,117 |
| Median | $98,174 | $74,711 |
| Interquartile 25% (IQ1) | $86,748 | $64,767 |
| Interquartile 75% (IQ3) | $110,162 | $83,511 |
| Interquartile Range (IQR) | $23,414 | $18,745 |
| Standard Deviation (Sample) | $18,764 | $16,133 |
| Standard Deviation (Population) | $18,426 | $15,843 |
Similar Demographics by Householder Income Ages 25 - 44 years
Demographics Similar to Immigrants from Poland by Householder Income Ages 25 - 44 years
In terms of householder income ages 25 - 44 years, the demographic groups most similar to Immigrants from Poland are Immigrants from Moldova ($101,091, a difference of 0.030%), Immigrants from Lebanon ($101,124, a difference of 0.060%), Albanian ($101,367, a difference of 0.30%), Immigrants from Argentina ($101,415, a difference of 0.35%), and Taiwanese ($101,492, a difference of 0.42%).
| Demographics | Rating | Rank | Householder Income Ages 25 - 44 years |
| Austrians | 98.3 /100 | #97 | Exceptional $101,842 |
| Immigrants | Kazakhstan | 98.1 /100 | #98 | Exceptional $101,727 |
| Taiwanese | 97.9 /100 | #99 | Exceptional $101,492 |
| Immigrants | Argentina | 97.8 /100 | #100 | Exceptional $101,415 |
| Albanians | 97.8 /100 | #101 | Exceptional $101,367 |
| Immigrants | Lebanon | 97.4 /100 | #102 | Exceptional $101,124 |
| Immigrants | Moldova | 97.4 /100 | #103 | Exceptional $101,091 |
| Immigrants | Poland | 97.4 /100 | #104 | Exceptional $101,065 |
| Immigrants | Vietnam | 96.5 /100 | #105 | Exceptional $100,535 |
| Immigrants | Brazil | 96.5 /100 | #106 | Exceptional $100,534 |
| Northern Europeans | 96.3 /100 | #107 | Exceptional $100,457 |
| Immigrants | South Eastern Asia | 96.0 /100 | #108 | Exceptional $100,283 |
| Immigrants | North Macedonia | 95.6 /100 | #109 | Exceptional $100,101 |
| Immigrants | Afghanistan | 95.3 /100 | #110 | Exceptional $99,977 |
| Chileans | 95.1 /100 | #111 | Exceptional $99,900 |
Demographics Similar to Houma by Householder Income Ages 25 - 44 years
In terms of householder income ages 25 - 44 years, the demographic groups most similar to Houma are Sioux ($77,089, a difference of 0.060%), Immigrants from Bahamas ($76,910, a difference of 0.17%), Dutch West Indian ($77,260, a difference of 0.28%), Immigrants from Honduras ($77,328, a difference of 0.37%), and Immigrants from Cuba ($76,701, a difference of 0.45%).
| Demographics | Rating | Rank | Householder Income Ages 25 - 44 years |
| Hondurans | 0.0 /100 | #319 | Tragic $78,540 |
| Choctaw | 0.0 /100 | #320 | Tragic $78,168 |
| Immigrants | Zaire | 0.0 /100 | #321 | Tragic $78,045 |
| Chickasaw | 0.0 /100 | #322 | Tragic $77,929 |
| Immigrants | Honduras | 0.0 /100 | #323 | Tragic $77,328 |
| Dutch West Indians | 0.0 /100 | #324 | Tragic $77,260 |
| Sioux | 0.0 /100 | #325 | Tragic $77,089 |
| Houma | 0.0 /100 | #326 | Tragic $77,044 |
| Immigrants | Bahamas | 0.0 /100 | #327 | Tragic $76,910 |
| Immigrants | Cuba | 0.0 /100 | #328 | Tragic $76,701 |
| Seminole | 0.0 /100 | #329 | Tragic $76,584 |
| Yakama | 0.0 /100 | #330 | Tragic $76,226 |
| Natives/Alaskans | 0.0 /100 | #331 | Tragic $75,647 |
| Bahamians | 0.0 /100 | #332 | Tragic $75,395 |
| Hopi | 0.0 /100 | #333 | Tragic $75,002 |