Immigrants from Poland vs Belgian Single Male Poverty
COMPARE
Immigrants from Poland
Belgian
Single Male Poverty
Single Male Poverty Comparison
Immigrants from Poland
Belgians
11.5%
SINGLE MALE POVERTY
99.9/ 100
METRIC RATING
45th/ 347
METRIC RANK
13.5%
SINGLE MALE POVERTY
1.2/ 100
METRIC RATING
247th/ 347
METRIC RANK
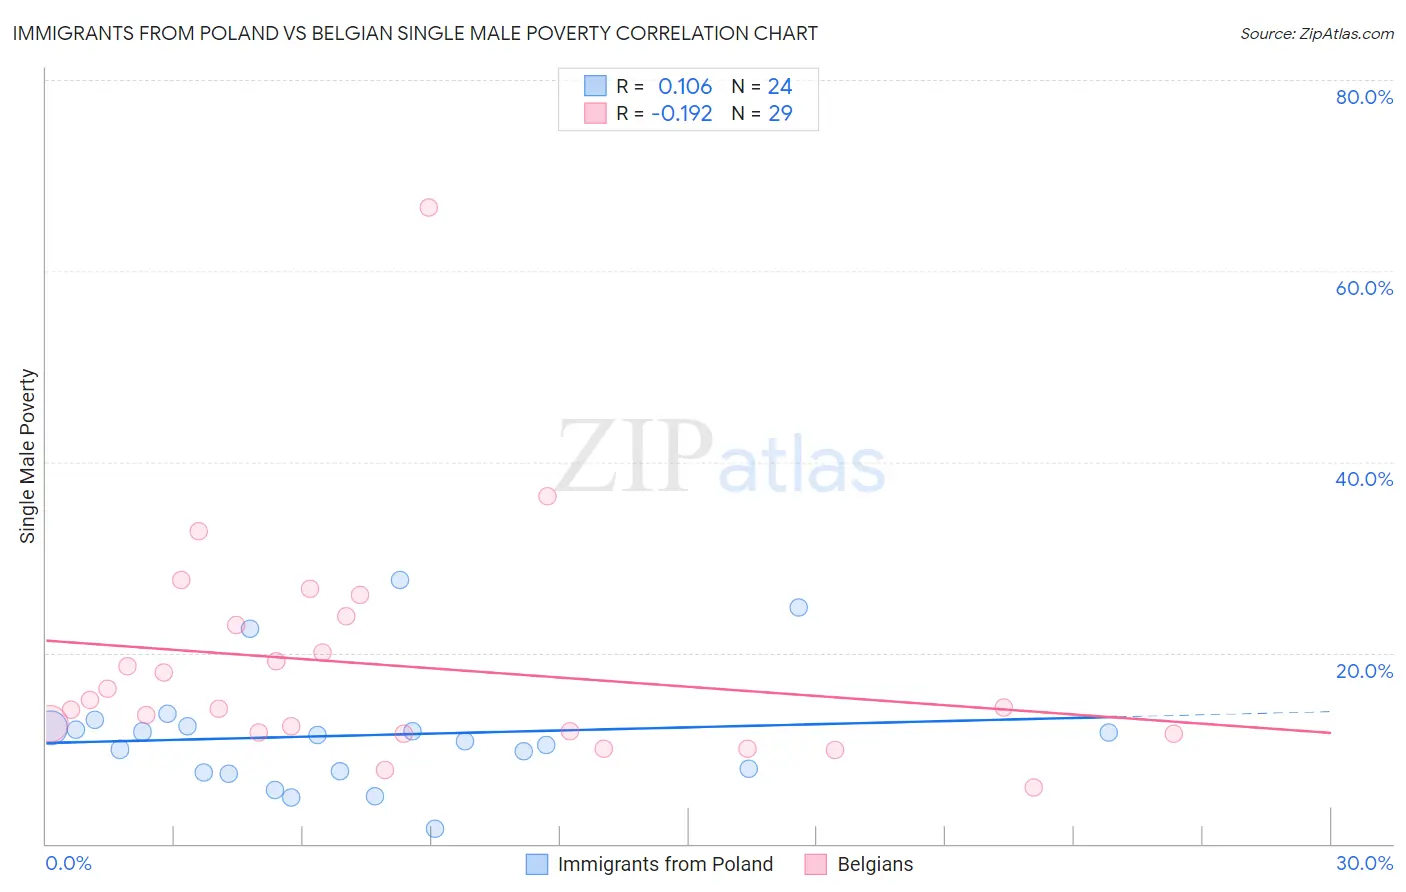
Immigrants from Poland vs Belgian Single Male Poverty Correlation Chart
The statistical analysis conducted on geographies consisting of 269,525,262 people shows a poor positive correlation between the proportion of Immigrants from Poland and poverty level among single males in the United States with a correlation coefficient (R) of 0.106 and weighted average of 11.5%. Similarly, the statistical analysis conducted on geographies consisting of 312,309,142 people shows a poor negative correlation between the proportion of Belgians and poverty level among single males in the United States with a correlation coefficient (R) of -0.192 and weighted average of 13.5%, a difference of 17.2%.
Single Male Poverty Correlation Summary
| Measurement | Immigrants from Poland | Belgian |
| Minimum | 1.6% | 5.9% |
| Maximum | 27.7% | 66.7% |
| Range | 26.1% | 60.8% |
| Mean | 11.4% | 18.6% |
| Median | 11.1% | 14.3% |
| Interquartile 25% (IQ1) | 7.6% | 11.6% |
| Interquartile 75% (IQ3) | 12.2% | 23.4% |
| Interquartile Range (IQR) | 4.7% | 11.7% |
| Standard Deviation (Sample) | 6.1% | 11.9% |
| Standard Deviation (Population) | 6.0% | 11.7% |
Similar Demographics by Single Male Poverty
Demographics Similar to Immigrants from Poland by Single Male Poverty
In terms of single male poverty, the demographic groups most similar to Immigrants from Poland are Immigrants from Cameroon (11.5%, a difference of 0.020%), Immigrants from Peru (11.5%, a difference of 0.030%), Immigrants from Bulgaria (11.6%, a difference of 0.13%), Egyptian (11.5%, a difference of 0.18%), and Immigrants from Iraq (11.5%, a difference of 0.23%).
| Demographics | Rating | Rank | Single Male Poverty |
| Sri Lankans | 100.0 /100 | #38 | Exceptional 11.5% |
| Soviet Union | 100.0 /100 | #39 | Exceptional 11.5% |
| Immigrants | Korea | 100.0 /100 | #40 | Exceptional 11.5% |
| Immigrants | Iraq | 99.9 /100 | #41 | Exceptional 11.5% |
| Egyptians | 99.9 /100 | #42 | Exceptional 11.5% |
| Immigrants | Peru | 99.9 /100 | #43 | Exceptional 11.5% |
| Immigrants | Cameroon | 99.9 /100 | #44 | Exceptional 11.5% |
| Immigrants | Poland | 99.9 /100 | #45 | Exceptional 11.5% |
| Immigrants | Bulgaria | 99.9 /100 | #46 | Exceptional 11.6% |
| Nepalese | 99.9 /100 | #47 | Exceptional 11.6% |
| Immigrants | Indonesia | 99.9 /100 | #48 | Exceptional 11.6% |
| Tlingit-Haida | 99.9 /100 | #49 | Exceptional 11.6% |
| Immigrants | Lithuania | 99.9 /100 | #50 | Exceptional 11.6% |
| Paraguayans | 99.9 /100 | #51 | Exceptional 11.6% |
| Samoans | 99.9 /100 | #52 | Exceptional 11.7% |
Demographics Similar to Belgians by Single Male Poverty
In terms of single male poverty, the demographic groups most similar to Belgians are Immigrants from Micronesia (13.5%, a difference of 0.010%), Czech (13.5%, a difference of 0.030%), Immigrants from Latin America (13.5%, a difference of 0.12%), Spanish (13.6%, a difference of 0.27%), and Immigrants from Somalia (13.6%, a difference of 0.29%).
| Demographics | Rating | Rank | Single Male Poverty |
| Belizeans | 2.3 /100 | #240 | Tragic 13.4% |
| Immigrants | Germany | 2.1 /100 | #241 | Tragic 13.4% |
| Carpatho Rusyns | 2.1 /100 | #242 | Tragic 13.4% |
| Barbadians | 2.1 /100 | #243 | Tragic 13.4% |
| Immigrants | Senegal | 1.7 /100 | #244 | Tragic 13.5% |
| Immigrants | Latin America | 1.3 /100 | #245 | Tragic 13.5% |
| Immigrants | Micronesia | 1.2 /100 | #246 | Tragic 13.5% |
| Belgians | 1.2 /100 | #247 | Tragic 13.5% |
| Czechs | 1.2 /100 | #248 | Tragic 13.5% |
| Spanish | 1.0 /100 | #249 | Tragic 13.6% |
| Immigrants | Somalia | 1.0 /100 | #250 | Tragic 13.6% |
| Immigrants | Zaire | 0.9 /100 | #251 | Tragic 13.6% |
| Finns | 0.9 /100 | #252 | Tragic 13.6% |
| German Russians | 0.8 /100 | #253 | Tragic 13.6% |
| Sub-Saharan Africans | 0.5 /100 | #254 | Tragic 13.7% |