Immigrants from Philippines vs Sioux Family Poverty
COMPARE
Immigrants from Philippines
Sioux
Family Poverty
Family Poverty Comparison
Immigrants from Philippines
Sioux
8.0%
FAMILY POVERTY
96.5/ 100
METRIC RATING
95th/ 347
METRIC RANK
15.9%
FAMILY POVERTY
0.0/ 100
METRIC RATING
336th/ 347
METRIC RANK
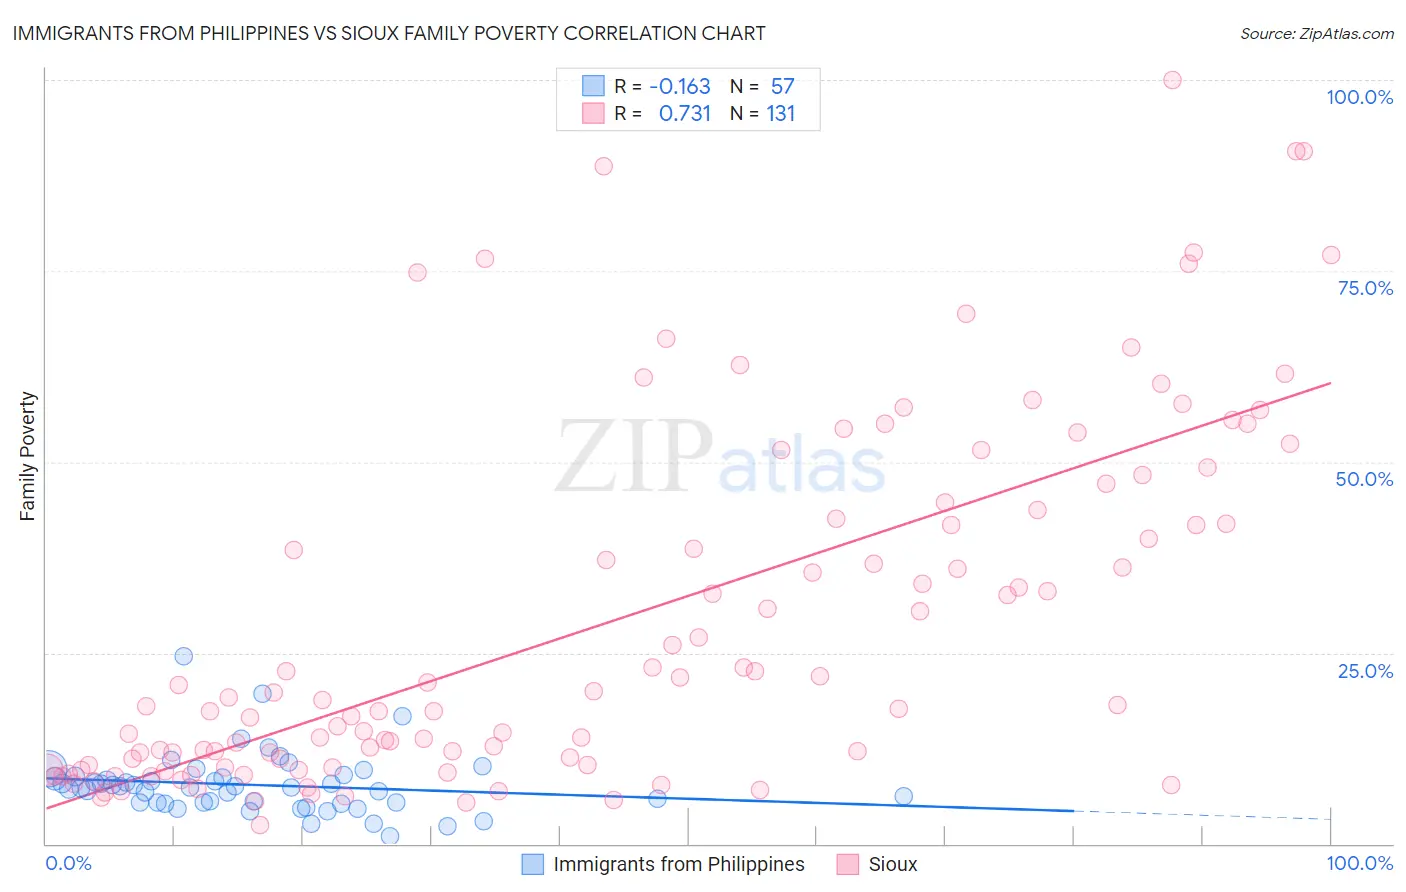
Immigrants from Philippines vs Sioux Family Poverty Correlation Chart
The statistical analysis conducted on geographies consisting of 469,729,486 people shows a poor negative correlation between the proportion of Immigrants from Philippines and poverty level among families in the United States with a correlation coefficient (R) of -0.163 and weighted average of 8.0%. Similarly, the statistical analysis conducted on geographies consisting of 233,799,830 people shows a strong positive correlation between the proportion of Sioux and poverty level among families in the United States with a correlation coefficient (R) of 0.731 and weighted average of 15.9%, a difference of 97.6%.
Family Poverty Correlation Summary
| Measurement | Immigrants from Philippines | Sioux |
| Minimum | 1.1% | 2.5% |
| Maximum | 24.5% | 100.0% |
| Range | 23.5% | 97.5% |
| Mean | 7.7% | 29.0% |
| Median | 7.4% | 18.8% |
| Interquartile 25% (IQ1) | 5.4% | 10.3% |
| Interquartile 75% (IQ3) | 8.7% | 43.6% |
| Interquartile Range (IQR) | 3.3% | 33.4% |
| Standard Deviation (Sample) | 4.0% | 23.2% |
| Standard Deviation (Population) | 3.9% | 23.1% |
Similar Demographics by Family Poverty
Demographics Similar to Immigrants from Philippines by Family Poverty
In terms of family poverty, the demographic groups most similar to Immigrants from Philippines are Immigrants from Pakistan (8.0%, a difference of 0.010%), Immigrants from Turkey (8.0%, a difference of 0.020%), Tlingit-Haida (8.0%, a difference of 0.12%), Czechoslovakian (8.0%, a difference of 0.30%), and Immigrants from Switzerland (8.1%, a difference of 0.43%).
| Demographics | Rating | Rank | Family Poverty |
| Serbians | 97.2 /100 | #88 | Exceptional 8.0% |
| Immigrants | Denmark | 97.1 /100 | #89 | Exceptional 8.0% |
| Immigrants | England | 97.1 /100 | #90 | Exceptional 8.0% |
| Immigrants | Italy | 97.0 /100 | #91 | Exceptional 8.0% |
| Czechoslovakians | 96.8 /100 | #92 | Exceptional 8.0% |
| Tlingit-Haida | 96.7 /100 | #93 | Exceptional 8.0% |
| Immigrants | Pakistan | 96.6 /100 | #94 | Exceptional 8.0% |
| Immigrants | Philippines | 96.5 /100 | #95 | Exceptional 8.0% |
| Immigrants | Turkey | 96.5 /100 | #96 | Exceptional 8.0% |
| Immigrants | Switzerland | 96.1 /100 | #97 | Exceptional 8.1% |
| Immigrants | South Africa | 95.9 /100 | #98 | Exceptional 8.1% |
| Welsh | 95.8 /100 | #99 | Exceptional 8.1% |
| New Zealanders | 95.8 /100 | #100 | Exceptional 8.1% |
| Immigrants | Norway | 95.7 /100 | #101 | Exceptional 8.1% |
| Immigrants | Indonesia | 95.7 /100 | #102 | Exceptional 8.1% |
Demographics Similar to Sioux by Family Poverty
In terms of family poverty, the demographic groups most similar to Sioux are Hopi (15.9%, a difference of 0.47%), Crow (16.1%, a difference of 1.6%), Yuman (16.6%, a difference of 5.0%), Pueblo (17.0%, a difference of 7.1%), and Lumbee (17.0%, a difference of 7.2%).
| Demographics | Rating | Rank | Family Poverty |
| Blacks/African Americans | 0.0 /100 | #329 | Tragic 13.3% |
| Natives/Alaskans | 0.0 /100 | #330 | Tragic 14.3% |
| Cheyenne | 0.0 /100 | #331 | Tragic 14.3% |
| Dominicans | 0.0 /100 | #332 | Tragic 14.3% |
| Immigrants | Dominican Republic | 0.0 /100 | #333 | Tragic 14.4% |
| Houma | 0.0 /100 | #334 | Tragic 14.6% |
| Apache | 0.0 /100 | #335 | Tragic 14.7% |
| Sioux | 0.0 /100 | #336 | Tragic 15.9% |
| Hopi | 0.0 /100 | #337 | Tragic 15.9% |
| Crow | 0.0 /100 | #338 | Tragic 16.1% |
| Yuman | 0.0 /100 | #339 | Tragic 16.6% |
| Pueblo | 0.0 /100 | #340 | Tragic 17.0% |
| Lumbee | 0.0 /100 | #341 | Tragic 17.0% |
| Immigrants | Yemen | 0.0 /100 | #342 | Tragic 17.5% |
| Pima | 0.0 /100 | #343 | Tragic 18.4% |