Immigrants from Philippines vs Taiwanese Family Poverty
COMPARE
Immigrants from Philippines
Taiwanese
Family Poverty
Family Poverty Comparison
Immigrants from Philippines
Taiwanese
8.0%
FAMILY POVERTY
96.5/ 100
METRIC RATING
95th/ 347
METRIC RANK
8.2%
FAMILY POVERTY
94.6/ 100
METRIC RATING
111th/ 347
METRIC RANK
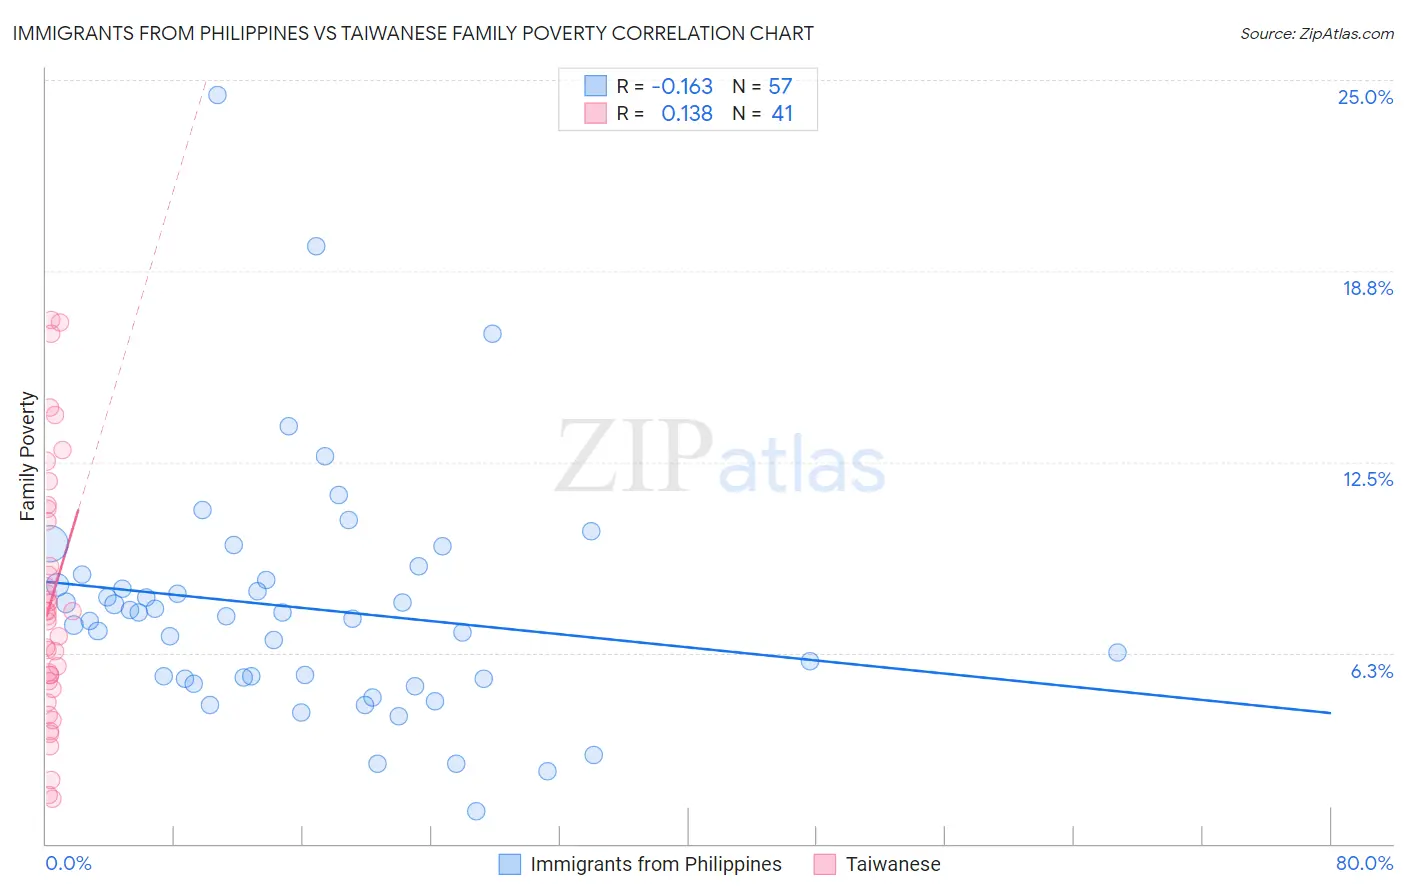
Immigrants from Philippines vs Taiwanese Family Poverty Correlation Chart
The statistical analysis conducted on geographies consisting of 469,729,486 people shows a poor negative correlation between the proportion of Immigrants from Philippines and poverty level among families in the United States with a correlation coefficient (R) of -0.163 and weighted average of 8.0%. Similarly, the statistical analysis conducted on geographies consisting of 31,669,641 people shows a poor positive correlation between the proportion of Taiwanese and poverty level among families in the United States with a correlation coefficient (R) of 0.138 and weighted average of 8.2%, a difference of 1.7%.
Family Poverty Correlation Summary
| Measurement | Immigrants from Philippines | Taiwanese |
| Minimum | 1.1% | 1.5% |
| Maximum | 24.5% | 17.2% |
| Range | 23.5% | 15.7% |
| Mean | 7.7% | 7.9% |
| Median | 7.4% | 7.4% |
| Interquartile 25% (IQ1) | 5.4% | 5.2% |
| Interquartile 75% (IQ3) | 8.7% | 10.8% |
| Interquartile Range (IQR) | 3.3% | 5.6% |
| Standard Deviation (Sample) | 4.0% | 4.1% |
| Standard Deviation (Population) | 3.9% | 4.1% |
Demographics Similar to Immigrants from Philippines and Taiwanese by Family Poverty
In terms of family poverty, the demographic groups most similar to Immigrants from Philippines are Immigrants from Pakistan (8.0%, a difference of 0.010%), Immigrants from Turkey (8.0%, a difference of 0.020%), Tlingit-Haida (8.0%, a difference of 0.12%), Immigrants from Switzerland (8.1%, a difference of 0.43%), and Immigrants from South Africa (8.1%, a difference of 0.64%). Similarly, the demographic groups most similar to Taiwanese are Romanian (8.2%, a difference of 0.060%), Immigrants from France (8.2%, a difference of 0.11%), Jordanian (8.2%, a difference of 0.15%), Basque (8.1%, a difference of 0.23%), and Canadian (8.2%, a difference of 0.28%).
| Demographics | Rating | Rank | Family Poverty |
| Tlingit-Haida | 96.7 /100 | #93 | Exceptional 8.0% |
| Immigrants | Pakistan | 96.6 /100 | #94 | Exceptional 8.0% |
| Immigrants | Philippines | 96.5 /100 | #95 | Exceptional 8.0% |
| Immigrants | Turkey | 96.5 /100 | #96 | Exceptional 8.0% |
| Immigrants | Switzerland | 96.1 /100 | #97 | Exceptional 8.1% |
| Immigrants | South Africa | 95.9 /100 | #98 | Exceptional 8.1% |
| Welsh | 95.8 /100 | #99 | Exceptional 8.1% |
| New Zealanders | 95.8 /100 | #100 | Exceptional 8.1% |
| Immigrants | Norway | 95.7 /100 | #101 | Exceptional 8.1% |
| Immigrants | Indonesia | 95.7 /100 | #102 | Exceptional 8.1% |
| Immigrants | Eastern Europe | 95.6 /100 | #103 | Exceptional 8.1% |
| Slavs | 95.6 /100 | #104 | Exceptional 8.1% |
| Laotians | 95.6 /100 | #105 | Exceptional 8.1% |
| Egyptians | 95.1 /100 | #106 | Exceptional 8.1% |
| French Canadians | 95.0 /100 | #107 | Exceptional 8.1% |
| Basques | 94.9 /100 | #108 | Exceptional 8.1% |
| Jordanians | 94.8 /100 | #109 | Exceptional 8.2% |
| Romanians | 94.7 /100 | #110 | Exceptional 8.2% |
| Taiwanese | 94.6 /100 | #111 | Exceptional 8.2% |
| Immigrants | France | 94.4 /100 | #112 | Exceptional 8.2% |
| Canadians | 94.2 /100 | #113 | Exceptional 8.2% |