Immigrants from Pakistan vs Israeli Single Female Poverty
COMPARE
Immigrants from Pakistan
Israeli
Single Female Poverty
Single Female Poverty Comparison
Immigrants from Pakistan
Israelis
18.4%
SINGLE FEMALE POVERTY
100.0/ 100
METRIC RATING
27th/ 347
METRIC RANK
19.9%
SINGLE FEMALE POVERTY
96.9/ 100
METRIC RATING
105th/ 347
METRIC RANK
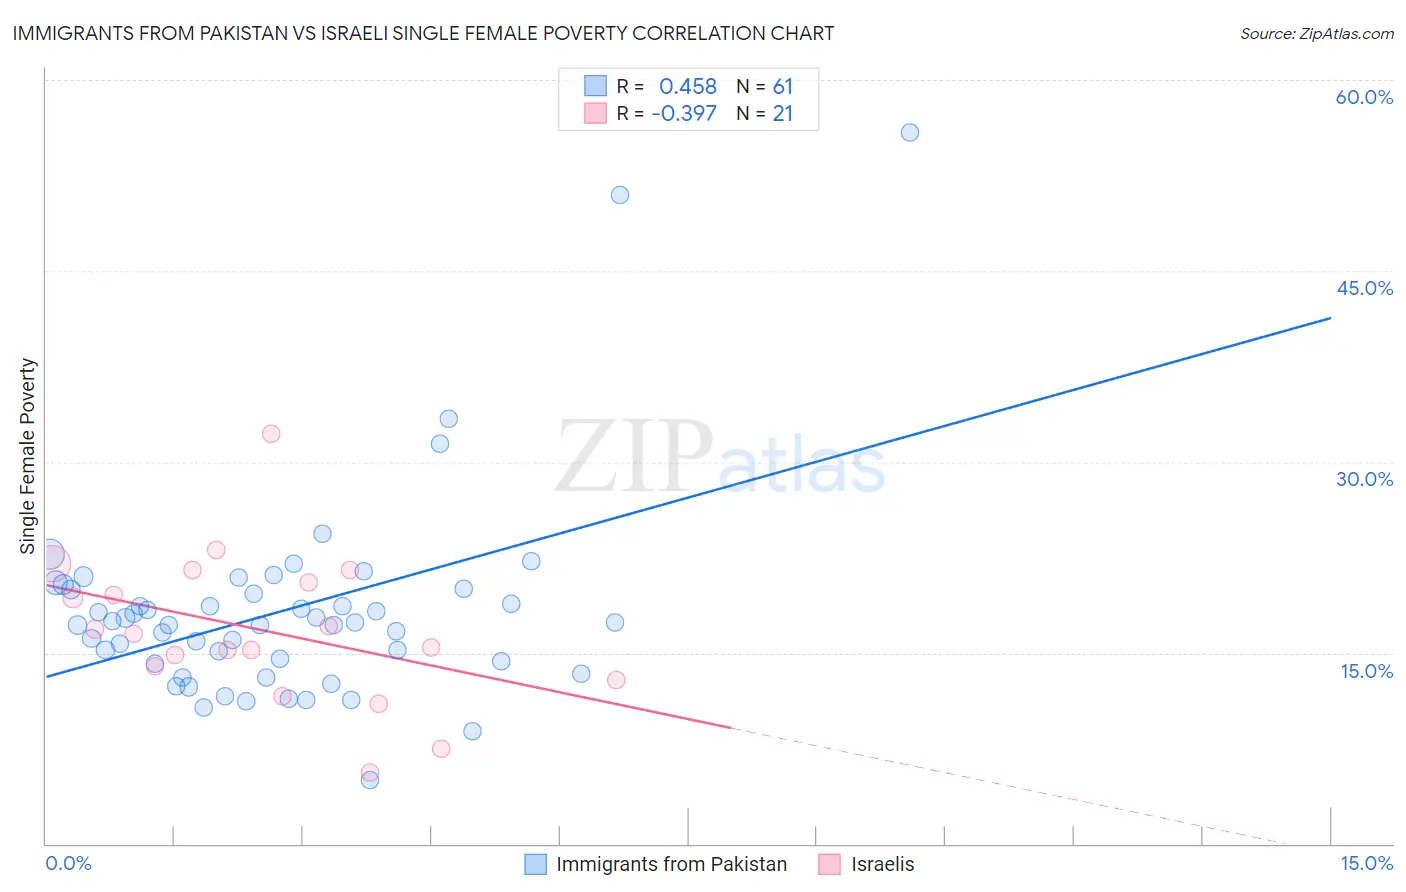
Immigrants from Pakistan vs Israeli Single Female Poverty Correlation Chart
The statistical analysis conducted on geographies consisting of 280,684,274 people shows a moderate positive correlation between the proportion of Immigrants from Pakistan and poverty level among single females in the United States with a correlation coefficient (R) of 0.458 and weighted average of 18.4%. Similarly, the statistical analysis conducted on geographies consisting of 208,686,807 people shows a mild negative correlation between the proportion of Israelis and poverty level among single females in the United States with a correlation coefficient (R) of -0.397 and weighted average of 19.9%, a difference of 8.1%.
Single Female Poverty Correlation Summary
| Measurement | Immigrants from Pakistan | Israeli |
| Minimum | 5.1% | 5.6% |
| Maximum | 55.9% | 32.2% |
| Range | 50.9% | 26.6% |
| Mean | 18.3% | 16.8% |
| Median | 17.3% | 16.5% |
| Interquartile 25% (IQ1) | 14.2% | 13.4% |
| Interquartile 75% (IQ3) | 20.0% | 21.0% |
| Interquartile Range (IQR) | 5.8% | 7.6% |
| Standard Deviation (Sample) | 8.0% | 5.8% |
| Standard Deviation (Population) | 8.0% | 5.7% |
Similar Demographics by Single Female Poverty
Demographics Similar to Immigrants from Pakistan by Single Female Poverty
In terms of single female poverty, the demographic groups most similar to Immigrants from Pakistan are Immigrants from Israel (18.3%, a difference of 0.33%), Immigrants from Singapore (18.3%, a difference of 0.36%), Armenian (18.3%, a difference of 0.46%), Immigrants from Moldova (18.5%, a difference of 0.49%), and Immigrants from Poland (18.5%, a difference of 0.59%).
| Demographics | Rating | Rank | Single Female Poverty |
| Immigrants | Greece | 100.0 /100 | #20 | Exceptional 18.3% |
| Maltese | 100.0 /100 | #21 | Exceptional 18.3% |
| Burmese | 100.0 /100 | #22 | Exceptional 18.3% |
| Asians | 100.0 /100 | #23 | Exceptional 18.3% |
| Armenians | 100.0 /100 | #24 | Exceptional 18.3% |
| Immigrants | Singapore | 100.0 /100 | #25 | Exceptional 18.3% |
| Immigrants | Israel | 100.0 /100 | #26 | Exceptional 18.3% |
| Immigrants | Pakistan | 100.0 /100 | #27 | Exceptional 18.4% |
| Immigrants | Moldova | 100.0 /100 | #28 | Exceptional 18.5% |
| Immigrants | Poland | 100.0 /100 | #29 | Exceptional 18.5% |
| Immigrants | North Macedonia | 99.9 /100 | #30 | Exceptional 18.5% |
| Immigrants | Asia | 99.9 /100 | #31 | Exceptional 18.6% |
| Immigrants | Sri Lanka | 99.9 /100 | #32 | Exceptional 18.6% |
| Immigrants | Philippines | 99.9 /100 | #33 | Exceptional 18.6% |
| Koreans | 99.9 /100 | #34 | Exceptional 18.6% |
Demographics Similar to Israelis by Single Female Poverty
In terms of single female poverty, the demographic groups most similar to Israelis are Chilean (19.9%, a difference of 0.010%), Ethiopian (19.9%, a difference of 0.090%), Immigrants from Syria (19.9%, a difference of 0.11%), Immigrants from Southern Europe (19.9%, a difference of 0.13%), and Native Hawaiian (19.9%, a difference of 0.16%).
| Demographics | Rating | Rank | Single Female Poverty |
| Immigrants | France | 97.9 /100 | #98 | Exceptional 19.7% |
| Sierra Leoneans | 97.9 /100 | #99 | Exceptional 19.7% |
| Ukrainians | 97.6 /100 | #100 | Exceptional 19.8% |
| Immigrants | Belgium | 97.3 /100 | #101 | Exceptional 19.8% |
| Immigrants | Cameroon | 97.3 /100 | #102 | Exceptional 19.8% |
| Immigrants | Southern Europe | 97.1 /100 | #103 | Exceptional 19.9% |
| Chileans | 96.9 /100 | #104 | Exceptional 19.9% |
| Israelis | 96.9 /100 | #105 | Exceptional 19.9% |
| Ethiopians | 96.7 /100 | #106 | Exceptional 19.9% |
| Immigrants | Syria | 96.7 /100 | #107 | Exceptional 19.9% |
| Native Hawaiians | 96.6 /100 | #108 | Exceptional 19.9% |
| Colombians | 96.6 /100 | #109 | Exceptional 19.9% |
| Immigrants | Western Asia | 96.5 /100 | #110 | Exceptional 19.9% |
| Carpatho Rusyns | 96.1 /100 | #111 | Exceptional 20.0% |
| Immigrants | Netherlands | 96.0 /100 | #112 | Exceptional 20.0% |