Immigrants from Pakistan vs Immigrants from Guyana Vision Disability
COMPARE
Immigrants from Pakistan
Immigrants from Guyana
Vision Disability
Vision Disability Comparison
Immigrants from Pakistan
Immigrants from Guyana
1.9%
VISION DISABILITY
100.0/ 100
METRIC RATING
22nd/ 347
METRIC RANK
2.2%
VISION DISABILITY
15.9/ 100
METRIC RATING
204th/ 347
METRIC RANK
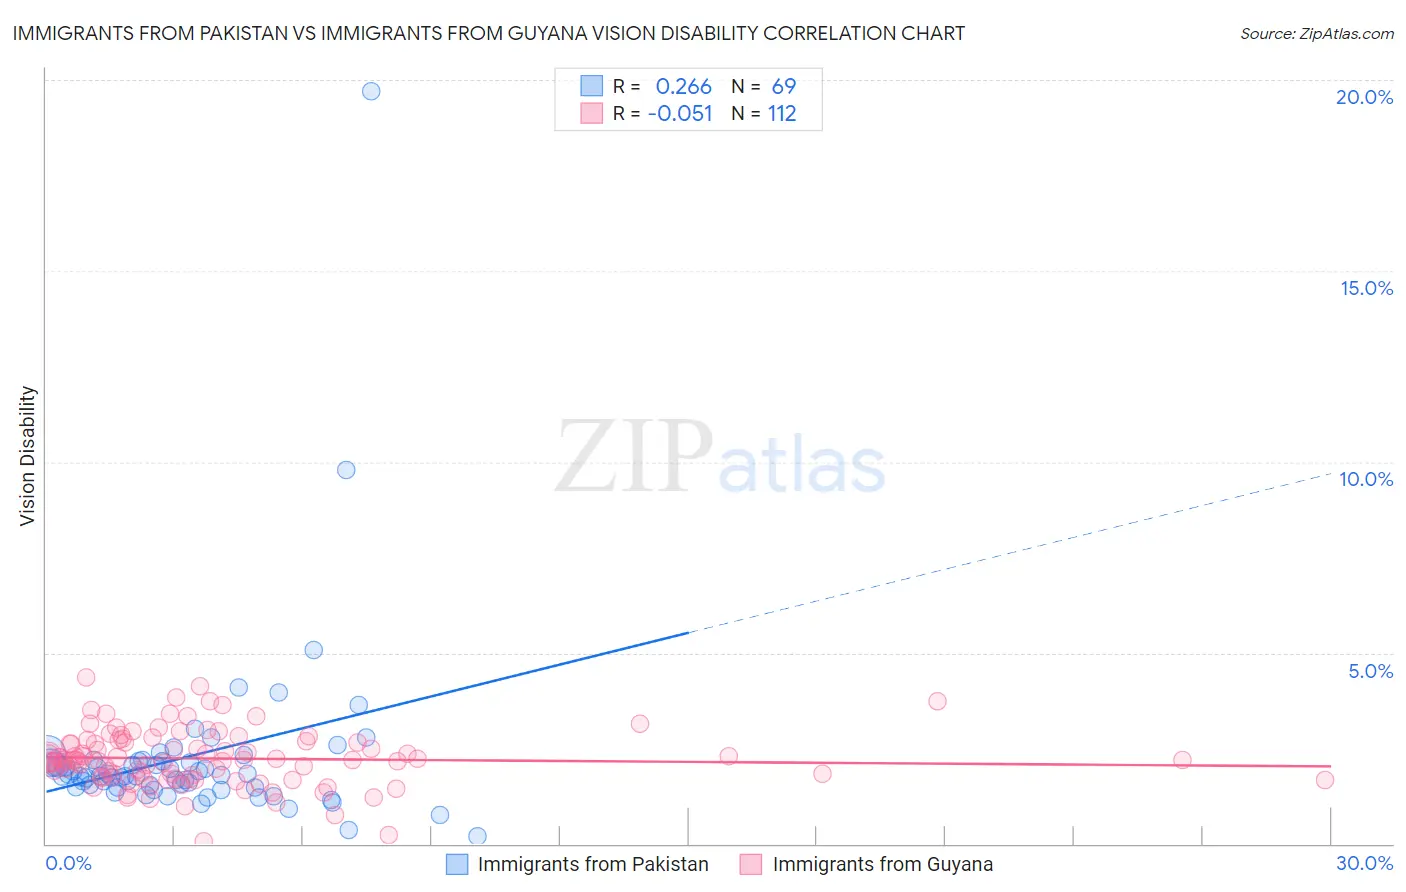
Immigrants from Pakistan vs Immigrants from Guyana Vision Disability Correlation Chart
The statistical analysis conducted on geographies consisting of 283,768,855 people shows a weak positive correlation between the proportion of Immigrants from Pakistan and percentage of population with vision disability in the United States with a correlation coefficient (R) of 0.266 and weighted average of 1.9%. Similarly, the statistical analysis conducted on geographies consisting of 183,609,151 people shows a slight negative correlation between the proportion of Immigrants from Guyana and percentage of population with vision disability in the United States with a correlation coefficient (R) of -0.051 and weighted average of 2.2%, a difference of 16.6%.
Vision Disability Correlation Summary
| Measurement | Immigrants from Pakistan | Immigrants from Guyana |
| Minimum | 0.21% | 0.051% |
| Maximum | 19.7% | 4.4% |
| Range | 19.5% | 4.3% |
| Mean | 2.3% | 2.2% |
| Median | 1.8% | 2.2% |
| Interquartile 25% (IQ1) | 1.5% | 1.7% |
| Interquartile 75% (IQ3) | 2.2% | 2.7% |
| Interquartile Range (IQR) | 0.69% | 0.95% |
| Standard Deviation (Sample) | 2.5% | 0.74% |
| Standard Deviation (Population) | 2.4% | 0.74% |
Similar Demographics by Vision Disability
Demographics Similar to Immigrants from Pakistan by Vision Disability
In terms of vision disability, the demographic groups most similar to Immigrants from Pakistan are Turkish (1.9%, a difference of 0.050%), Asian (1.9%, a difference of 0.35%), Immigrants from Asia (1.9%, a difference of 0.54%), Immigrants from Lithuania (1.9%, a difference of 0.66%), and Bulgarian (1.9%, a difference of 0.70%).
| Demographics | Rating | Rank | Vision Disability |
| Immigrants | Bolivia | 100.0 /100 | #15 | Exceptional 1.8% |
| Indians (Asian) | 100.0 /100 | #16 | Exceptional 1.8% |
| Burmese | 100.0 /100 | #17 | Exceptional 1.8% |
| Bolivians | 100.0 /100 | #18 | Exceptional 1.9% |
| Immigrants | Sri Lanka | 100.0 /100 | #19 | Exceptional 1.9% |
| Asians | 100.0 /100 | #20 | Exceptional 1.9% |
| Turks | 100.0 /100 | #21 | Exceptional 1.9% |
| Immigrants | Pakistan | 100.0 /100 | #22 | Exceptional 1.9% |
| Immigrants | Asia | 99.9 /100 | #23 | Exceptional 1.9% |
| Immigrants | Lithuania | 99.9 /100 | #24 | Exceptional 1.9% |
| Bulgarians | 99.9 /100 | #25 | Exceptional 1.9% |
| Immigrants | Japan | 99.9 /100 | #26 | Exceptional 1.9% |
| Taiwanese | 99.9 /100 | #27 | Exceptional 1.9% |
| Immigrants | Malaysia | 99.9 /100 | #28 | Exceptional 1.9% |
| Egyptians | 99.9 /100 | #29 | Exceptional 1.9% |
Demographics Similar to Immigrants from Guyana by Vision Disability
In terms of vision disability, the demographic groups most similar to Immigrants from Guyana are Samoan (2.2%, a difference of 0.030%), Dutch (2.2%, a difference of 0.13%), Pennsylvania German (2.2%, a difference of 0.17%), Immigrants from Zaire (2.2%, a difference of 0.23%), and Immigrants from Nigeria (2.2%, a difference of 0.30%).
| Demographics | Rating | Rank | Vision Disability |
| Ghanaians | 21.8 /100 | #197 | Fair 2.2% |
| Czechoslovakians | 21.6 /100 | #198 | Fair 2.2% |
| Immigrants | El Salvador | 21.0 /100 | #199 | Fair 2.2% |
| Immigrants | Thailand | 20.1 /100 | #200 | Fair 2.2% |
| Slovaks | 18.8 /100 | #201 | Poor 2.2% |
| Immigrants | Zaire | 18.0 /100 | #202 | Poor 2.2% |
| Dutch | 17.1 /100 | #203 | Poor 2.2% |
| Immigrants | Guyana | 15.9 /100 | #204 | Poor 2.2% |
| Samoans | 15.7 /100 | #205 | Poor 2.2% |
| Pennsylvania Germans | 14.5 /100 | #206 | Poor 2.2% |
| Immigrants | Nigeria | 13.5 /100 | #207 | Poor 2.2% |
| Germans | 13.4 /100 | #208 | Poor 2.2% |
| Immigrants | Brazil | 13.1 /100 | #209 | Poor 2.2% |
| Immigrants | Uruguay | 11.5 /100 | #210 | Poor 2.2% |
| Indonesians | 9.5 /100 | #211 | Tragic 2.2% |