Immigrants from Norway vs Scottish 5th Grade
COMPARE
Immigrants from Norway
Scottish
5th Grade
5th Grade Comparison
Immigrants from Norway
Scottish
97.6%
5TH GRADE
94.6/ 100
METRIC RATING
123rd/ 347
METRIC RANK
98.3%
5TH GRADE
100.0/ 100
METRIC RATING
15th/ 347
METRIC RANK
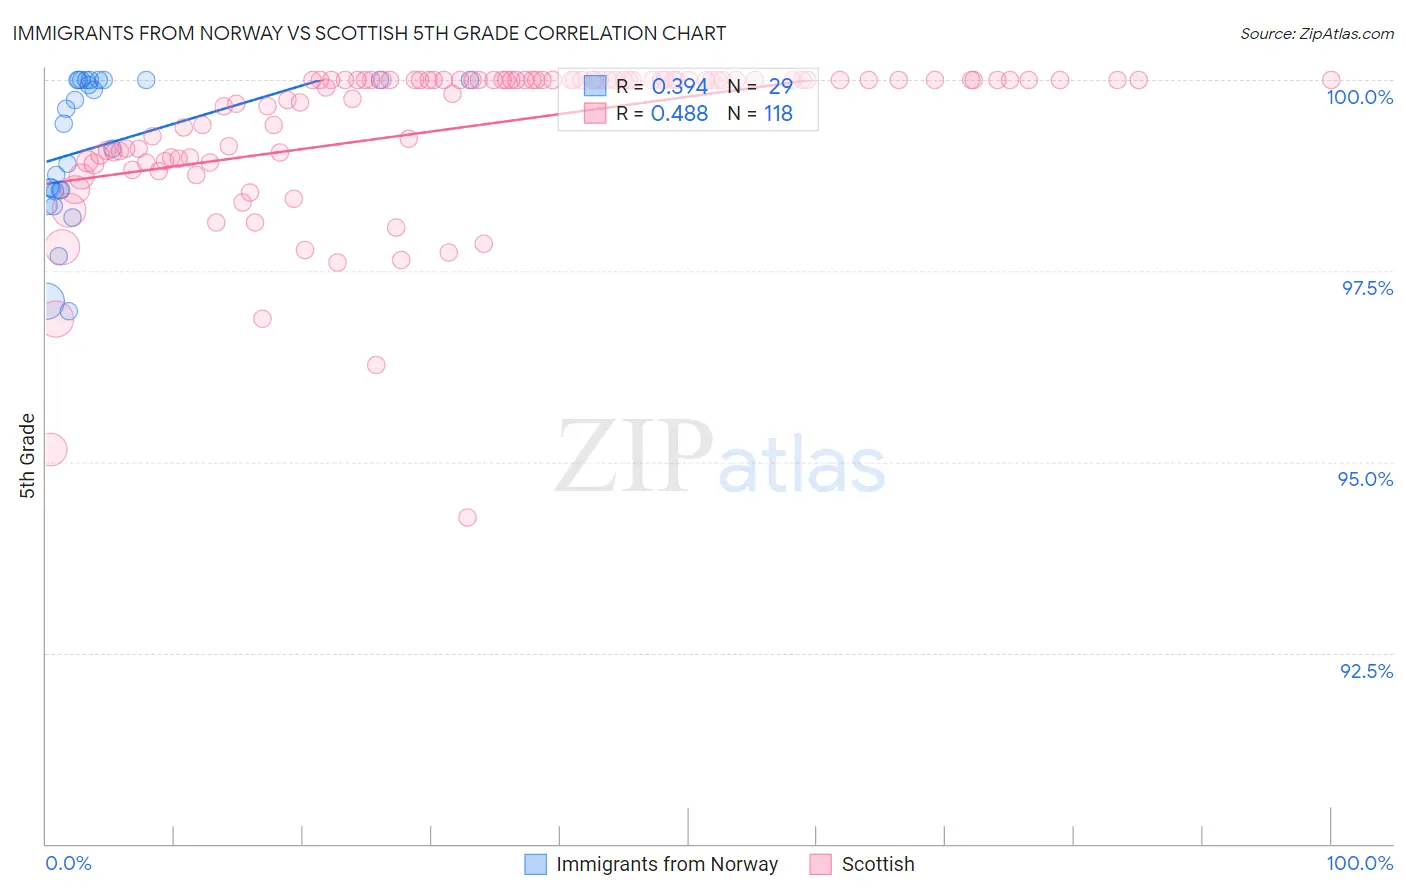
Immigrants from Norway vs Scottish 5th Grade Correlation Chart
The statistical analysis conducted on geographies consisting of 116,716,420 people shows a mild positive correlation between the proportion of Immigrants from Norway and percentage of population with at least 5th grade education in the United States with a correlation coefficient (R) of 0.394 and weighted average of 97.6%. Similarly, the statistical analysis conducted on geographies consisting of 567,141,733 people shows a moderate positive correlation between the proportion of Scottish and percentage of population with at least 5th grade education in the United States with a correlation coefficient (R) of 0.488 and weighted average of 98.3%, a difference of 0.67%.
5th Grade Correlation Summary
| Measurement | Immigrants from Norway | Scottish |
| Minimum | 97.0% | 94.3% |
| Maximum | 100.0% | 100.0% |
| Range | 3.0% | 5.7% |
| Mean | 99.1% | 99.4% |
| Median | 99.4% | 100.0% |
| Interquartile 25% (IQ1) | 98.5% | 99.0% |
| Interquartile 75% (IQ3) | 100.0% | 100.0% |
| Interquartile Range (IQR) | 1.5% | 1.0% |
| Standard Deviation (Sample) | 0.93% | 1.0% |
| Standard Deviation (Population) | 0.91% | 1.0% |
Similar Demographics by 5th Grade
Demographics Similar to Immigrants from Norway by 5th Grade
In terms of 5th grade, the demographic groups most similar to Immigrants from Norway are Immigrants from France (97.6%, a difference of 0.0%), Immigrants from Japan (97.6%, a difference of 0.0%), Basque (97.6%, a difference of 0.010%), Syrian (97.6%, a difference of 0.010%), and Immigrants from Zimbabwe (97.6%, a difference of 0.010%).
| Demographics | Rating | Rank | 5th Grade |
| Immigrants | Croatia | 95.5 /100 | #116 | Exceptional 97.6% |
| Immigrants | Saudi Arabia | 95.4 /100 | #117 | Exceptional 97.6% |
| Basques | 95.2 /100 | #118 | Exceptional 97.6% |
| Syrians | 95.1 /100 | #119 | Exceptional 97.6% |
| Immigrants | Zimbabwe | 94.9 /100 | #120 | Exceptional 97.6% |
| Immigrants | France | 94.8 /100 | #121 | Exceptional 97.6% |
| Immigrants | Japan | 94.7 /100 | #122 | Exceptional 97.6% |
| Immigrants | Norway | 94.6 /100 | #123 | Exceptional 97.6% |
| Spanish | 93.7 /100 | #124 | Exceptional 97.6% |
| Immigrants | Bulgaria | 93.1 /100 | #125 | Exceptional 97.6% |
| Hmong | 92.3 /100 | #126 | Exceptional 97.6% |
| Immigrants | Serbia | 92.3 /100 | #127 | Exceptional 97.6% |
| Colville | 92.0 /100 | #128 | Exceptional 97.6% |
| Immigrants | Europe | 91.9 /100 | #129 | Exceptional 97.6% |
| Immigrants | Romania | 91.6 /100 | #130 | Exceptional 97.6% |
Demographics Similar to Scottish by 5th Grade
In terms of 5th grade, the demographic groups most similar to Scottish are Dutch (98.3%, a difference of 0.010%), Polish (98.3%, a difference of 0.010%), Tlingit-Haida (98.3%, a difference of 0.020%), Irish (98.3%, a difference of 0.020%), and Pennsylvania German (98.3%, a difference of 0.020%).
| Demographics | Rating | Rank | 5th Grade |
| Slovenes | 100.0 /100 | #8 | Exceptional 98.3% |
| Swedes | 100.0 /100 | #9 | Exceptional 98.3% |
| English | 100.0 /100 | #10 | Exceptional 98.3% |
| Alaskan Athabascans | 100.0 /100 | #11 | Exceptional 98.3% |
| Carpatho Rusyns | 100.0 /100 | #12 | Exceptional 98.3% |
| Tlingit-Haida | 100.0 /100 | #13 | Exceptional 98.3% |
| Dutch | 100.0 /100 | #14 | Exceptional 98.3% |
| Scottish | 100.0 /100 | #15 | Exceptional 98.3% |
| Poles | 100.0 /100 | #16 | Exceptional 98.3% |
| Irish | 100.0 /100 | #17 | Exceptional 98.3% |
| Pennsylvania Germans | 100.0 /100 | #18 | Exceptional 98.3% |
| Finns | 100.0 /100 | #19 | Exceptional 98.2% |
| Lithuanians | 100.0 /100 | #20 | Exceptional 98.2% |
| Danes | 100.0 /100 | #21 | Exceptional 98.2% |
| Croatians | 100.0 /100 | #22 | Exceptional 98.2% |