Immigrants from Norway vs European Female Poverty
COMPARE
Immigrants from Norway
European
Female Poverty
Female Poverty Comparison
Immigrants from Norway
Europeans
12.8%
FEMALE POVERTY
89.3/ 100
METRIC RATING
124th/ 347
METRIC RANK
12.3%
FEMALE POVERTY
97.4/ 100
METRIC RATING
75th/ 347
METRIC RANK
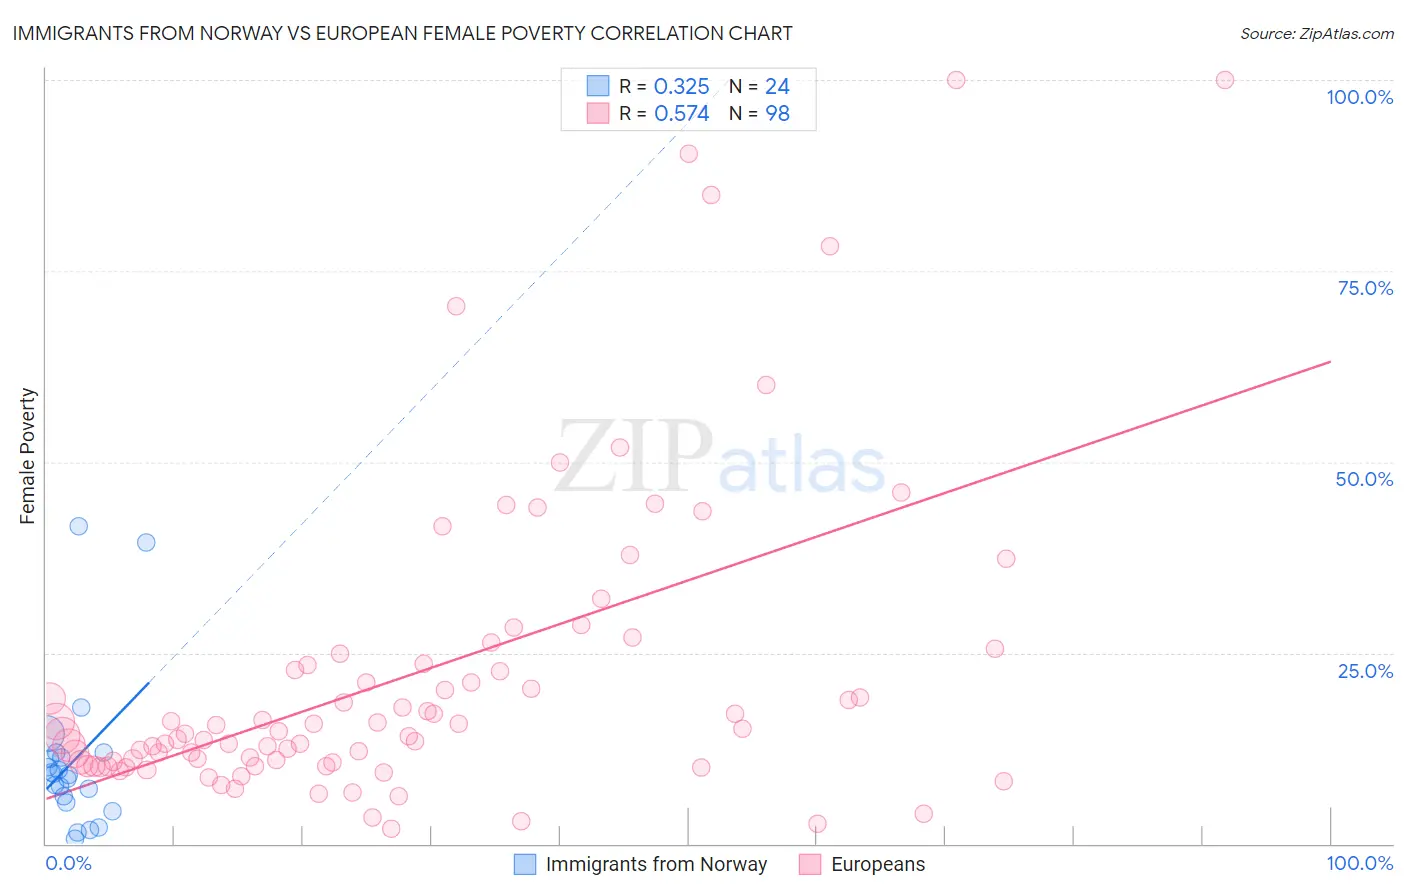
Immigrants from Norway vs European Female Poverty Correlation Chart
The statistical analysis conducted on geographies consisting of 116,674,936 people shows a mild positive correlation between the proportion of Immigrants from Norway and poverty level among females in the United States with a correlation coefficient (R) of 0.325 and weighted average of 12.8%. Similarly, the statistical analysis conducted on geographies consisting of 560,757,214 people shows a substantial positive correlation between the proportion of Europeans and poverty level among females in the United States with a correlation coefficient (R) of 0.574 and weighted average of 12.3%, a difference of 4.0%.
Female Poverty Correlation Summary
| Measurement | Immigrants from Norway | European |
| Minimum | 0.68% | 1.9% |
| Maximum | 41.6% | 100.0% |
| Range | 40.9% | 98.1% |
| Mean | 10.8% | 22.2% |
| Median | 9.1% | 14.5% |
| Interquartile 25% (IQ1) | 5.8% | 10.7% |
| Interquartile 75% (IQ3) | 11.6% | 23.6% |
| Interquartile Range (IQR) | 5.8% | 12.9% |
| Standard Deviation (Sample) | 10.0% | 20.6% |
| Standard Deviation (Population) | 9.8% | 20.5% |
Similar Demographics by Female Poverty
Demographics Similar to Immigrants from Norway by Female Poverty
In terms of female poverty, the demographic groups most similar to Immigrants from Norway are Argentinean (12.8%, a difference of 0.050%), Immigrants from Ukraine (12.8%, a difference of 0.12%), Immigrants from South Eastern Asia (12.7%, a difference of 0.18%), South African (12.8%, a difference of 0.23%), and French Canadian (12.7%, a difference of 0.24%).
| Demographics | Rating | Rank | Female Poverty |
| Immigrants | Southern Europe | 90.9 /100 | #117 | Exceptional 12.7% |
| Sri Lankans | 90.9 /100 | #118 | Exceptional 12.7% |
| Albanians | 90.8 /100 | #119 | Exceptional 12.7% |
| New Zealanders | 90.6 /100 | #120 | Exceptional 12.7% |
| Immigrants | Hungary | 90.3 /100 | #121 | Exceptional 12.7% |
| French Canadians | 90.2 /100 | #122 | Exceptional 12.7% |
| Immigrants | South Eastern Asia | 89.9 /100 | #123 | Excellent 12.7% |
| Immigrants | Norway | 89.3 /100 | #124 | Excellent 12.8% |
| Argentineans | 89.1 /100 | #125 | Excellent 12.8% |
| Immigrants | Ukraine | 88.8 /100 | #126 | Excellent 12.8% |
| South Africans | 88.4 /100 | #127 | Excellent 12.8% |
| Immigrants | Belarus | 88.2 /100 | #128 | Excellent 12.8% |
| Immigrants | Brazil | 87.9 /100 | #129 | Excellent 12.8% |
| Immigrants | Vietnam | 87.1 /100 | #130 | Excellent 12.8% |
| Immigrants | Argentina | 87.0 /100 | #131 | Excellent 12.8% |
Demographics Similar to Europeans by Female Poverty
In terms of female poverty, the demographic groups most similar to Europeans are Immigrants from Canada (12.3%, a difference of 0.12%), Zimbabwean (12.3%, a difference of 0.13%), Cambodian (12.2%, a difference of 0.15%), Immigrants from Eastern Europe (12.3%, a difference of 0.17%), and Carpatho Rusyn (12.2%, a difference of 0.18%).
| Demographics | Rating | Rank | Female Poverty |
| Immigrants | Netherlands | 97.8 /100 | #68 | Exceptional 12.2% |
| Swiss | 97.7 /100 | #69 | Exceptional 12.2% |
| Immigrants | Belgium | 97.7 /100 | #70 | Exceptional 12.2% |
| Carpatho Rusyns | 97.6 /100 | #71 | Exceptional 12.2% |
| Cambodians | 97.5 /100 | #72 | Exceptional 12.2% |
| Zimbabweans | 97.5 /100 | #73 | Exceptional 12.3% |
| Immigrants | Canada | 97.5 /100 | #74 | Exceptional 12.3% |
| Europeans | 97.4 /100 | #75 | Exceptional 12.3% |
| Immigrants | Eastern Europe | 97.2 /100 | #76 | Exceptional 12.3% |
| Serbians | 97.2 /100 | #77 | Exceptional 12.3% |
| Egyptians | 97.2 /100 | #78 | Exceptional 12.3% |
| Immigrants | North America | 97.1 /100 | #79 | Exceptional 12.3% |
| Slovaks | 97.1 /100 | #80 | Exceptional 12.3% |
| Immigrants | Sweden | 97.1 /100 | #81 | Exceptional 12.3% |
| Jordanians | 97.1 /100 | #82 | Exceptional 12.3% |